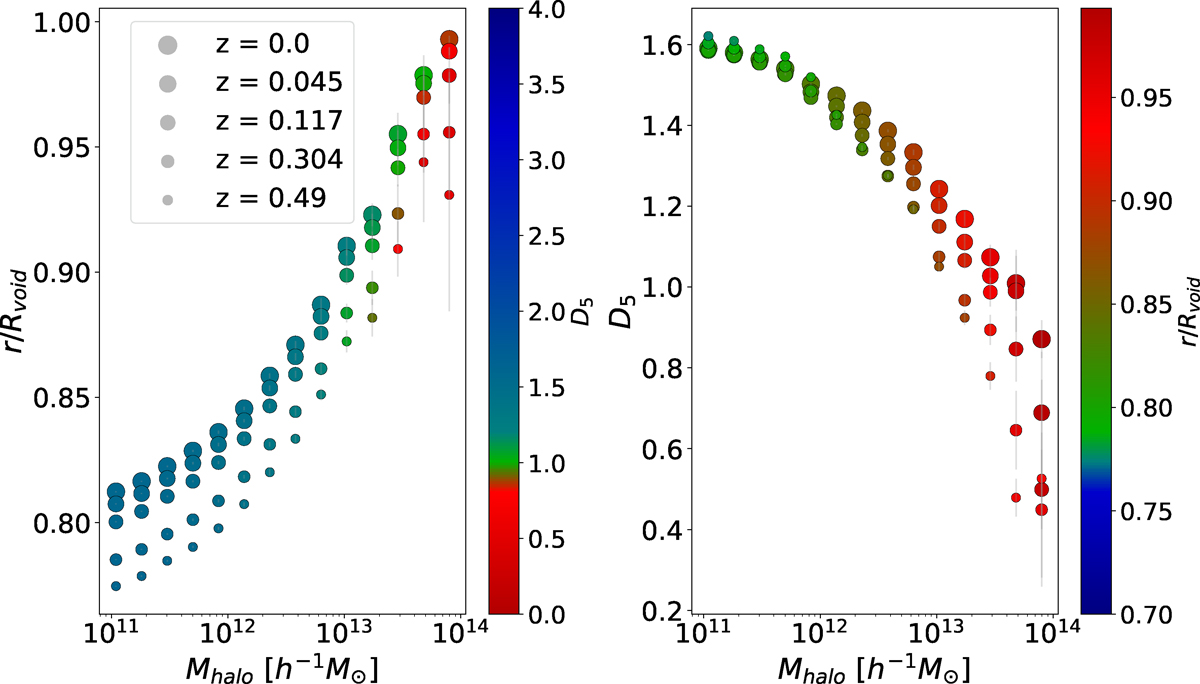
Fig. 8.
Download original image
Left panel: Normalized distance from the void center of central galaxies in voids at z = 0 as a function of their halo mass for five redshift samples. Circle sizes decrease with increasing redshift, and the color scale represents the mean D5 for each mass bin. Right panel: Variation in D5 with halo mass for the same samples. The color scale indicates the mean r/Rvoid for each bin. The error lines were estimated via the Jackknife resampling method and using 50 subsamples.
Current usage metrics show cumulative count of Article Views (full-text article views including HTML views, PDF and ePub downloads, according to the available data) and Abstracts Views on Vision4Press platform.
Data correspond to usage on the plateform after 2015. The current usage metrics is available 48-96 hours after online publication and is updated daily on week days.
Initial download of the metrics may take a while.