Fig. 1.
Download original image
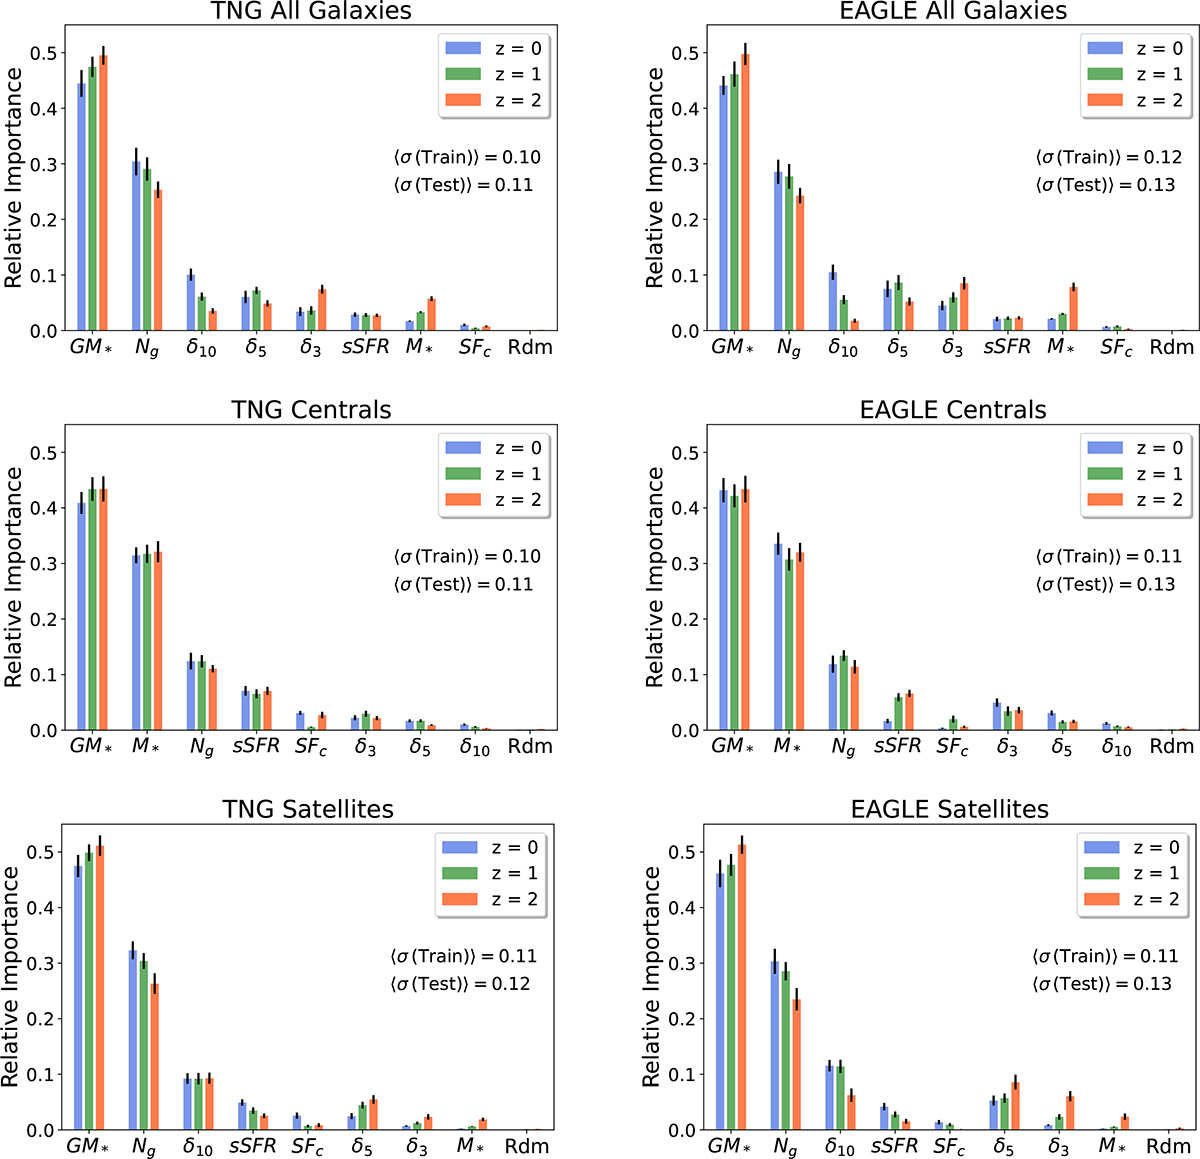
Random forest regression analyses showing the predictive importance of various observable galaxy and environmental parameters for inferring dark matter halo mass, explicitly M200 (as listed along the x-axis; see Section 3.3 for definitions). The left column shows results from the TNG simulation; the right column shows results for the EAGLE simulation. Results for all galaxies are shown in the top row, results for central galaxies are shown in the middle row, and results for satellite galaxies are shown in the bottom row. In each panel, results are shown separately for three redshift snapshots (z = 0, 1, 2). The uncertainties on the relative importance are computed as the standard deviation across 100 independent runs. The overall average performance of the random forest regressor (![]() ) is shown in each panel for both the training and independent testing samples (each containing 50% of the full data set). For all populations of galaxies, and at all epochs studied, the total group stellar mass is seen to be the most predictive parameter for inferring halo masses in both EAGLE & TNG. The second most important parameter depends on galaxy class, with the number of galaxies in the group being the second most important parameter for all galaxies and satellites, and stellar mass being the second most important parameter for centrals. All other investigated parameters (e.g., local densities, star formation tracers) are substantially less predictive than the first three parameters. We note that there is a high degree of similarity between the simulations and redshift snapshots, which implies that these results are not strongly model-dependent and do not vary significantly with cosmic time.
) is shown in each panel for both the training and independent testing samples (each containing 50% of the full data set). For all populations of galaxies, and at all epochs studied, the total group stellar mass is seen to be the most predictive parameter for inferring halo masses in both EAGLE & TNG. The second most important parameter depends on galaxy class, with the number of galaxies in the group being the second most important parameter for all galaxies and satellites, and stellar mass being the second most important parameter for centrals. All other investigated parameters (e.g., local densities, star formation tracers) are substantially less predictive than the first three parameters. We note that there is a high degree of similarity between the simulations and redshift snapshots, which implies that these results are not strongly model-dependent and do not vary significantly with cosmic time.
Current usage metrics show cumulative count of Article Views (full-text article views including HTML views, PDF and ePub downloads, according to the available data) and Abstracts Views on Vision4Press platform.
Data correspond to usage on the plateform after 2015. The current usage metrics is available 48-96 hours after online publication and is updated daily on week days.
Initial download of the metrics may take a while.