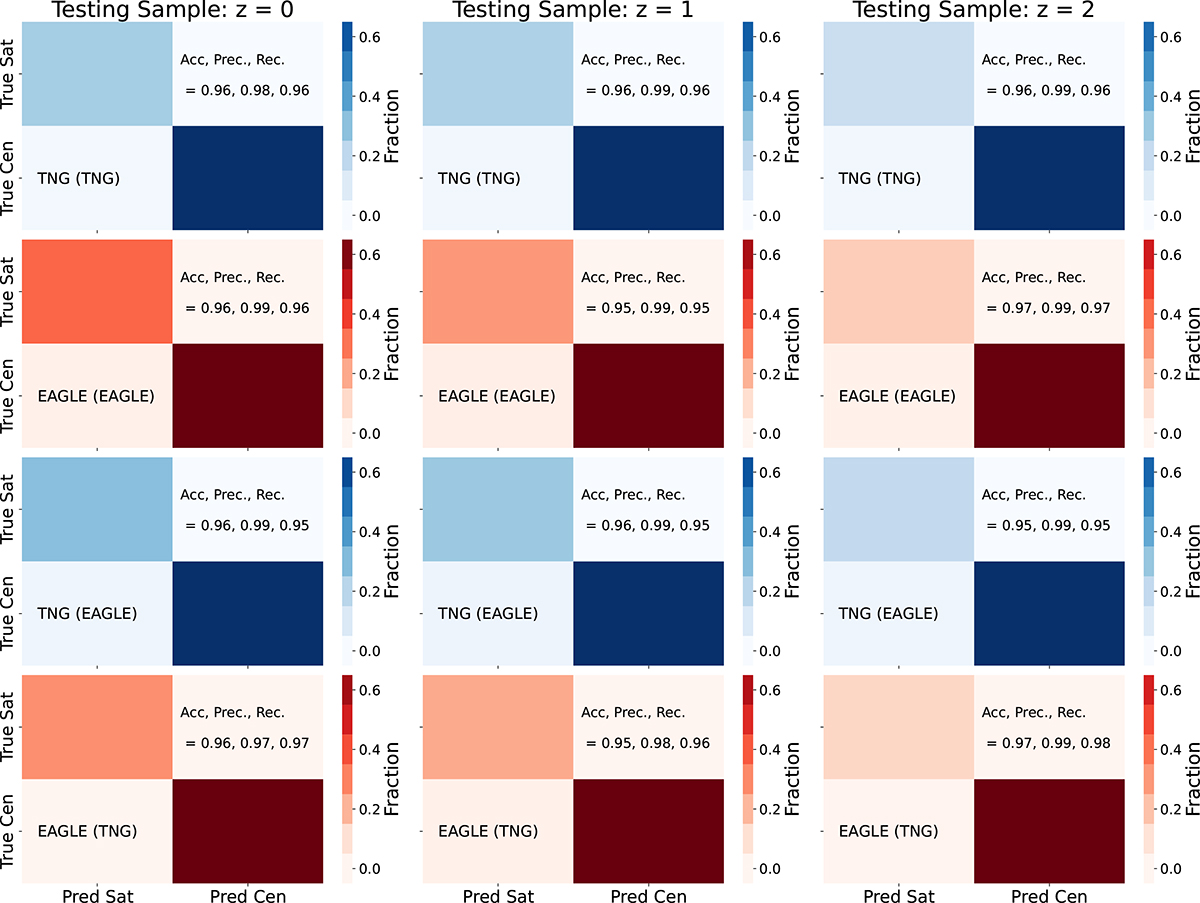
Fig. 10.
Download original image
Central – (core) satellite classification results from the DfL pipeline. The structure of this figure is identical to Figs. 6, 7, and 9. Each panel displays the confusion matrix, which plots true centrals and satellites against predicted centrals and satellites, with the color of each rectangular region indicating the fraction of data in each quadrant (as labeled by the color bars). The sum of all quadrants equals unity. A perfect classification would have all data on the diagonal in each panel, or equivalently dark colored rectangles on the diagonal and white space in the off-diagonal regions. Three statistics are indicated in each panel (see Eqs. (28)–(30) for definitions): the accuracy in separation between central and satellite galaxies (Acc.), the precision in identifying centrals (Prec.), and the recall (Rec.), which quantifies the completeness of the recovered central population. All results are shown here for centrals compared to the core satellite population. The average accuracy across all epochs is 96%, and this is largely unaffected by model choice.
Current usage metrics show cumulative count of Article Views (full-text article views including HTML views, PDF and ePub downloads, according to the available data) and Abstracts Views on Vision4Press platform.
Data correspond to usage on the plateform after 2015. The current usage metrics is available 48-96 hours after online publication and is updated daily on week days.
Initial download of the metrics may take a while.