Fig. 11.
Download original image
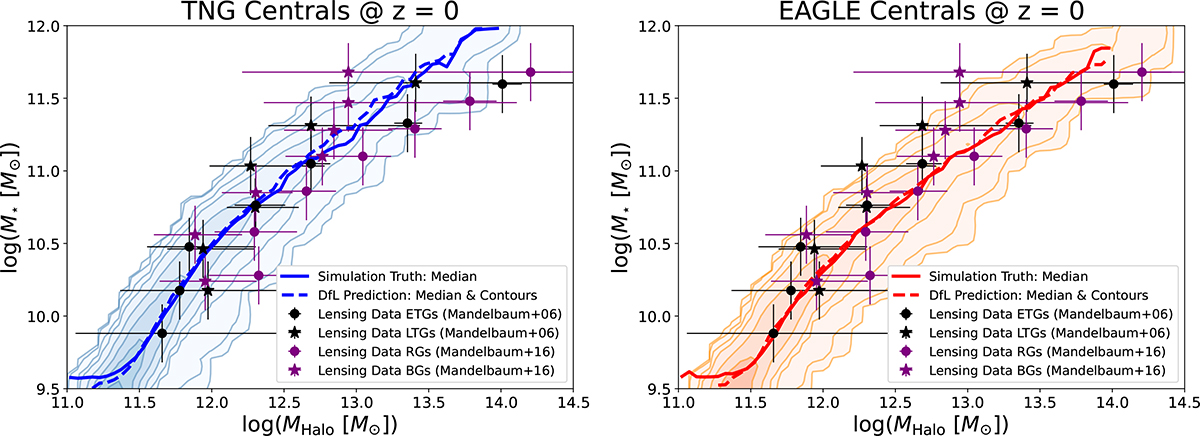
Test of DfL with observational data at z ∼ 0. The stellar mass – halo mass relation for central galaxies in TNG (left panel) and EAGLE (right panel), compared to observations from strong gravitational lensing. In both panels the solid colored line indicates the true stellar mass – halo mass relation from each simulation; the dashed colored line indicates this relationship as recovered from observational-like data with the DfL pipeline. Clearly, there is excellent agreement, demonstrating that the DfL pipeline can reproduce the true stellar mass – halo mass relationship from each simulation to high fidelity. The contours in each panel show the full range in the stellar mass – halo mass relationship as ascertained through the DfL pipeline. Additionally, observational constraints from gravitational lensing are shown in each panel, taken from Mandelbaum et al. (2006, 2016). In both cases, DfL does a good job at reproducing the observations (both the general trend and the observed scatter). However, the TNG simulation appears visually to be slightly more accurate compared to EAGLE at z = 0.
Current usage metrics show cumulative count of Article Views (full-text article views including HTML views, PDF and ePub downloads, according to the available data) and Abstracts Views on Vision4Press platform.
Data correspond to usage on the plateform after 2015. The current usage metrics is available 48-96 hours after online publication and is updated daily on week days.
Initial download of the metrics may take a while.