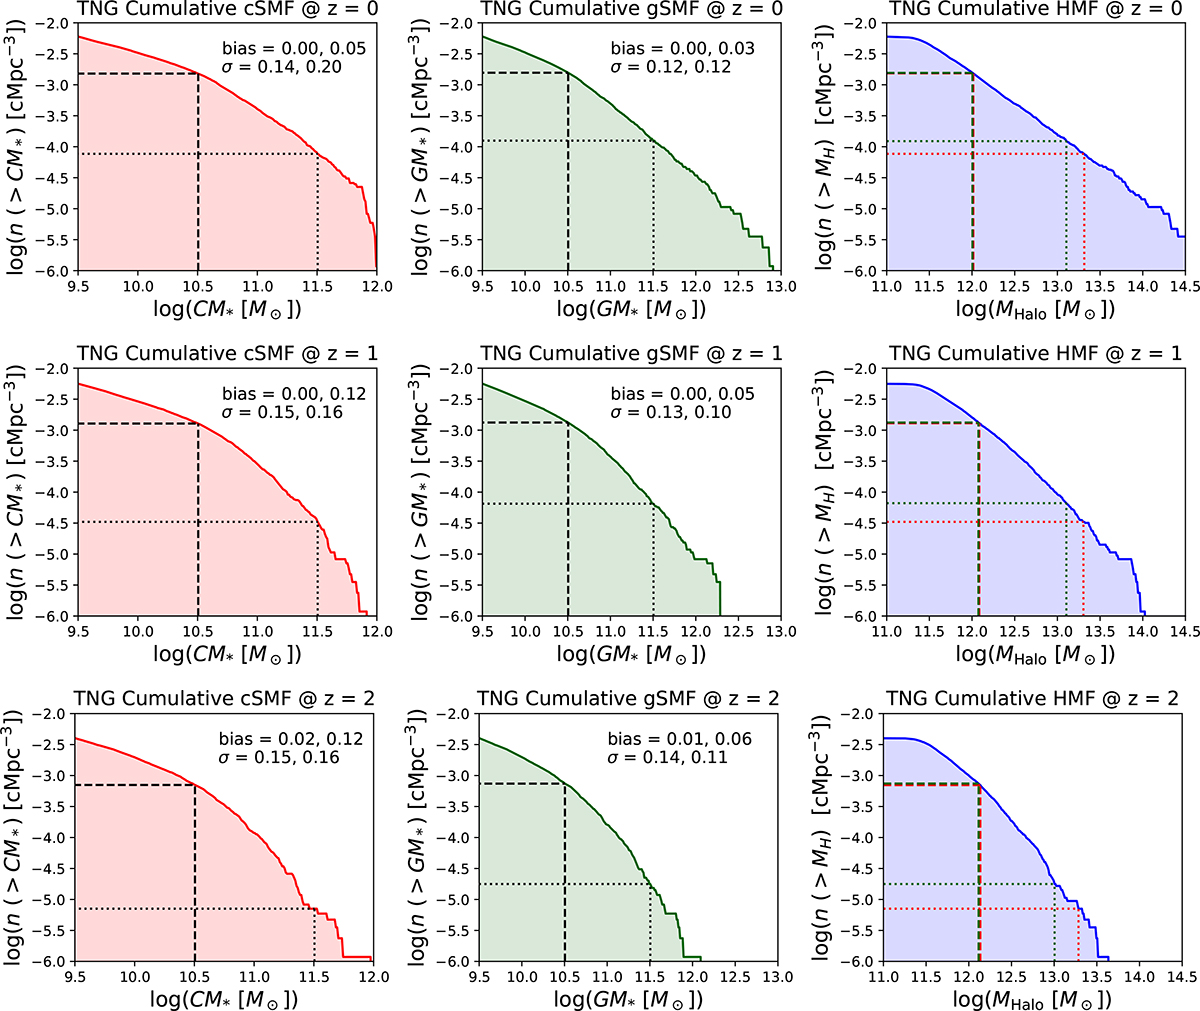
Fig. B.2.
Download original image
Illustration of the abundance matching approach applied to centrals and groups for the TNG simulation. The rows show results from different redshift snapshots, and the columns indicate (from left to right) the cumulative central stellar mass function, the cumulative group total stellar mass function, and the cumulative halo mass function (explicitly computed for M200). In abundance matching the cumulative number densities of either the central stellar mass or the group total stellar mass are matched to the cumulative number density of the halo mass function. Dashed and dotted lines indicate this matching procedure, and illustrate how the matching between central and group stellar mass is not in general identical (especially at high masses). In this method we train and test on different subsamples from within each simulation. Indicated on the stellar mass function panels are the bias and standard deviation in halo mass recovery from abundance matching within each approach. Additionally, the performance is given for all groups (first value) and for multi-galaxy groups (second value, after comma). Performing abundance matching on the total group stellar mass is superior to with the central stellar mass, and this is particularly evident for multi-galaxy groups (as one might expect).
Current usage metrics show cumulative count of Article Views (full-text article views including HTML views, PDF and ePub downloads, according to the available data) and Abstracts Views on Vision4Press platform.
Data correspond to usage on the plateform after 2015. The current usage metrics is available 48-96 hours after online publication and is updated daily on week days.
Initial download of the metrics may take a while.