Fig. 2.
Download original image
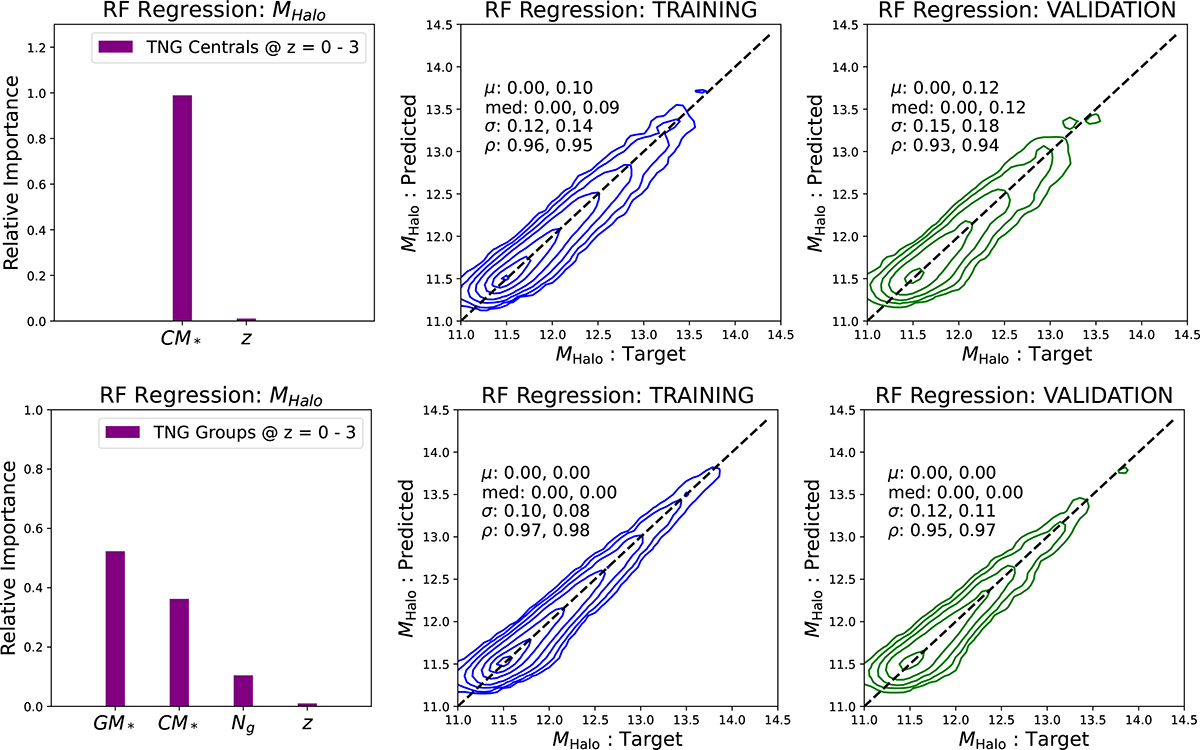
Training and validation of the RF regression models in the TNG simulation at z = 0 − 3. The top panels show the results from the central-only RF model and the bottom panels show the results from the full group model. The left panels show the distribution in relative importance for the parameters used in training. This includes central galaxy stellar mass (CM*) and redshift (z) for the central-only run, and adds group stellar mass (GM*) and the number of galaxies in the group (Ng) in the case of the full group run (see Section 3 for full definitions of these parameters). The center panels show the recovery of halo mass in the training stage and the right panels show the recovery of halo mass in the unseen validation sample (which is used to optimize the performance). The mean (μ) and median (med) offset, standard deviation (σ), and Spearman rank correlation strength (ρ) are displayed for all groups (left) and multi-galaxy groups (right, after comma) for both training and testing. There is a modest improvement in performance in the full group RF model compared to the central-only model for the full data set. Crucially, however, the improvement is much more significant for the multi-galaxy groups. Hence, there is a clear need to incorporate the group information in order to have unbiased and more accurate halo mass estimation for groups and clusters.
Current usage metrics show cumulative count of Article Views (full-text article views including HTML views, PDF and ePub downloads, according to the available data) and Abstracts Views on Vision4Press platform.
Data correspond to usage on the plateform after 2015. The current usage metrics is available 48-96 hours after online publication and is updated daily on week days.
Initial download of the metrics may take a while.