Fig. 3.
Download original image
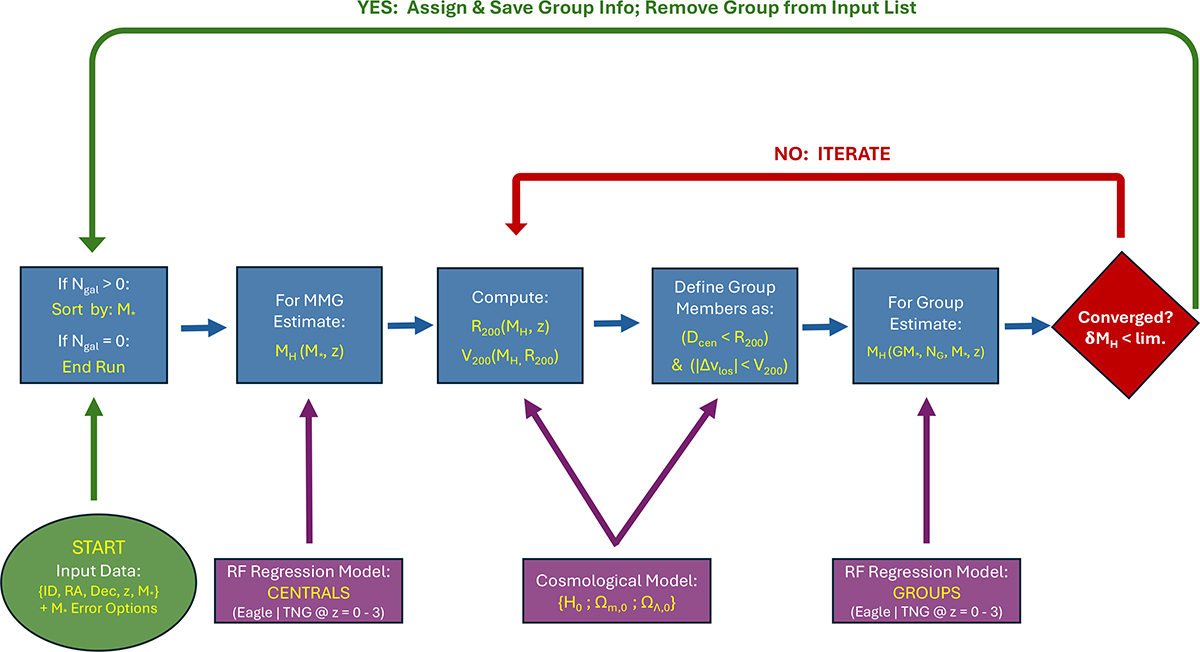
Flow chart depicting the DfL pipeline, used to assign galaxies to haloes. The pipeline only requires as input data a unique galaxy identifier (ID), coordinates (RA, Dec), spectroscopic redshift (z), and a stellar mass estimate (M*), plus optional uncertainties, for each galaxy in the survey. Additionally, one may specify the preferred cosmological parameters and the preferred simulation to use (here either TNG or EAGLE). First, the number of galaxies in the survey remaining to be assigned to a group is checked (Ngal), provided this is greater than zero the remaining galaxies are sorted by stellar mass and the most massive galaxy in the survey is taken to be a central. Second, the halo mass of the central is estimated by applying the central galaxy regression model (see Section 3.4.1). Third, the virial radius and virial velocity of the halo are computed using the initial halo mass estimate, redshift, and the specified cosmology. Fourth, all galaxies within one virial radius and one virial velocity of the central galaxy are added to the proto-group. Fifth, the halo mass is re-estimated using the full regression model (see Section 3.4.2), here incorporating the total stellar mass of the group and the number of galaxies in the group with M* > 109.5 M⊙, in addition to the central’s stellar mass and redshift. Finally, the two halo mass estimates are compared. If they are within a variable tolerance limit of each other (default value of lim. =0.05 dex), the group is fixed and removed from the input data set. The pipeline then continues from the start for the most massive galaxy remaining in the survey. If the estimates are not converged, the virial radius and velocity are updated with the new halo mass estimate and the group is redefined accordingly. Through iteration the halo may grow or shrink in phase space until convergence is reached (or else an optional limit is exceeded, default value: Nlim. = 10). Once converged, the pipeline begins again from the start on the reduced data set until every single galaxy within the survey is classified (as either a central or a satellite) and the halo properties are provided for each group.
Current usage metrics show cumulative count of Article Views (full-text article views including HTML views, PDF and ePub downloads, according to the available data) and Abstracts Views on Vision4Press platform.
Data correspond to usage on the plateform after 2015. The current usage metrics is available 48-96 hours after online publication and is updated daily on week days.
Initial download of the metrics may take a while.