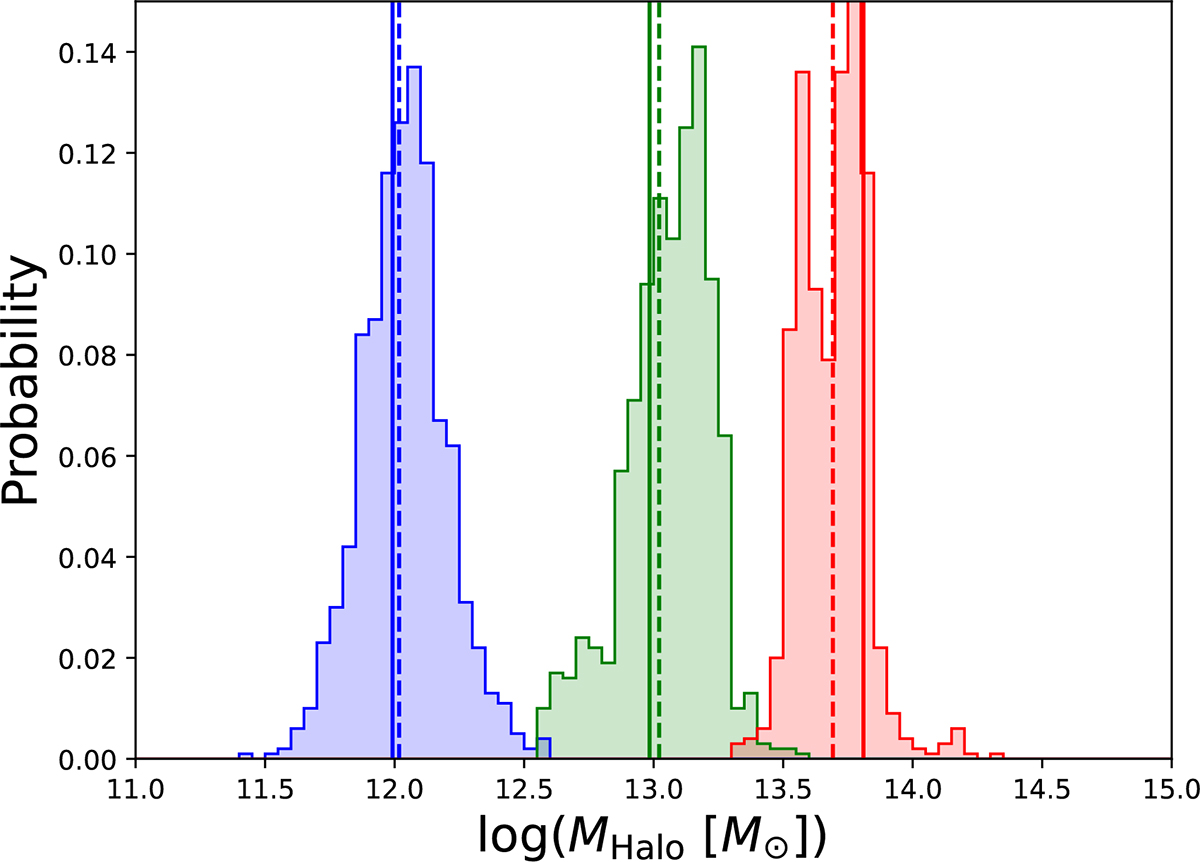
Fig. 5.

Download original image
Example of output halo mass PDFs from DfL from the TNG model applied to the TNG testing data at z = 1. The shaded histograms show the probability distributions of the halo mass for a randomly selected low-, intermediate-, and high-mass group (colored blue, green, and red, respectively). The true halo mass from the simulation is indicated by a vertical solid line, with the DfL geometric mean output from the pipeline indicated by a vertical dashed line. The PDF can be used to extract the mode, linear mean, or any other indicator for the best mass prediction for M200, as desired.
Current usage metrics show cumulative count of Article Views (full-text article views including HTML views, PDF and ePub downloads, according to the available data) and Abstracts Views on Vision4Press platform.
Data correspond to usage on the plateform after 2015. The current usage metrics is available 48-96 hours after online publication and is updated daily on week days.
Initial download of the metrics may take a while.


