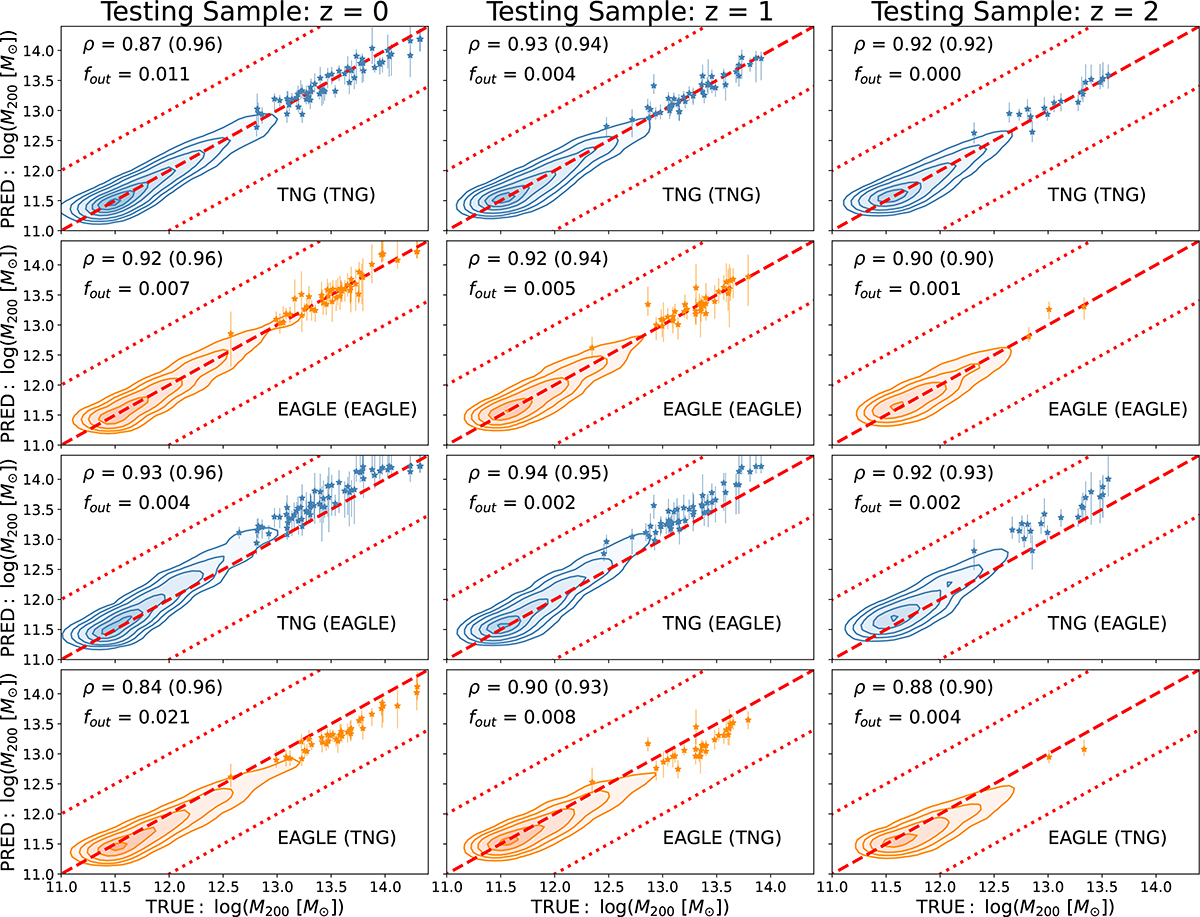
Fig. 6.
Download original image
Halo mass recovery performance with DfL I: DfL Predicted vs. simulation truth M200 density contours for all output galaxy groups (including isolated galaxies). In addition to contours, we also show as star-shaped points (with error bars) the location of the largest groups and clusters at each epoch (those with Ng > 5). This allows one to assess the recovery of this small but important population, which are not well represented by the density contours, due to these being dominated by the most numerous lower-mass haloes. The figure is structured as follows: Columns indicate redshift snapshots (as labeled at the top), and rows indicate data – model pairings (as indicated in the panels). The top row shows results for TNG data using the TNG regression model (trained and validated on different subsets of the data). The second row shows the equivalent results for EAGLE data using an EAGLE trained model. The third and fourth rows show the results for TNG data using an EAGLE model and vice versa, respectively. In each panel the one-to-one relation is indicated by a dashed red line, and ±1 dex is indicated by dotted red lines to help indicate scale. Also in each panel the Spearman correlation strength (ρ) and the fraction of catastrophic outliers (fout, i.e., those with |δMHalo|> 1 dex) are shown. In parentheses, we additionally show the correlation strength excluding the very rare case of catastrophic outliers. We note that visually the recovery of halo masses from luminous tracers is excellent when the appropriate model and data pairing is used, but that a modest bias is induced when the model and the data are mismatched.
Current usage metrics show cumulative count of Article Views (full-text article views including HTML views, PDF and ePub downloads, according to the available data) and Abstracts Views on Vision4Press platform.
Data correspond to usage on the plateform after 2015. The current usage metrics is available 48-96 hours after online publication and is updated daily on week days.
Initial download of the metrics may take a while.