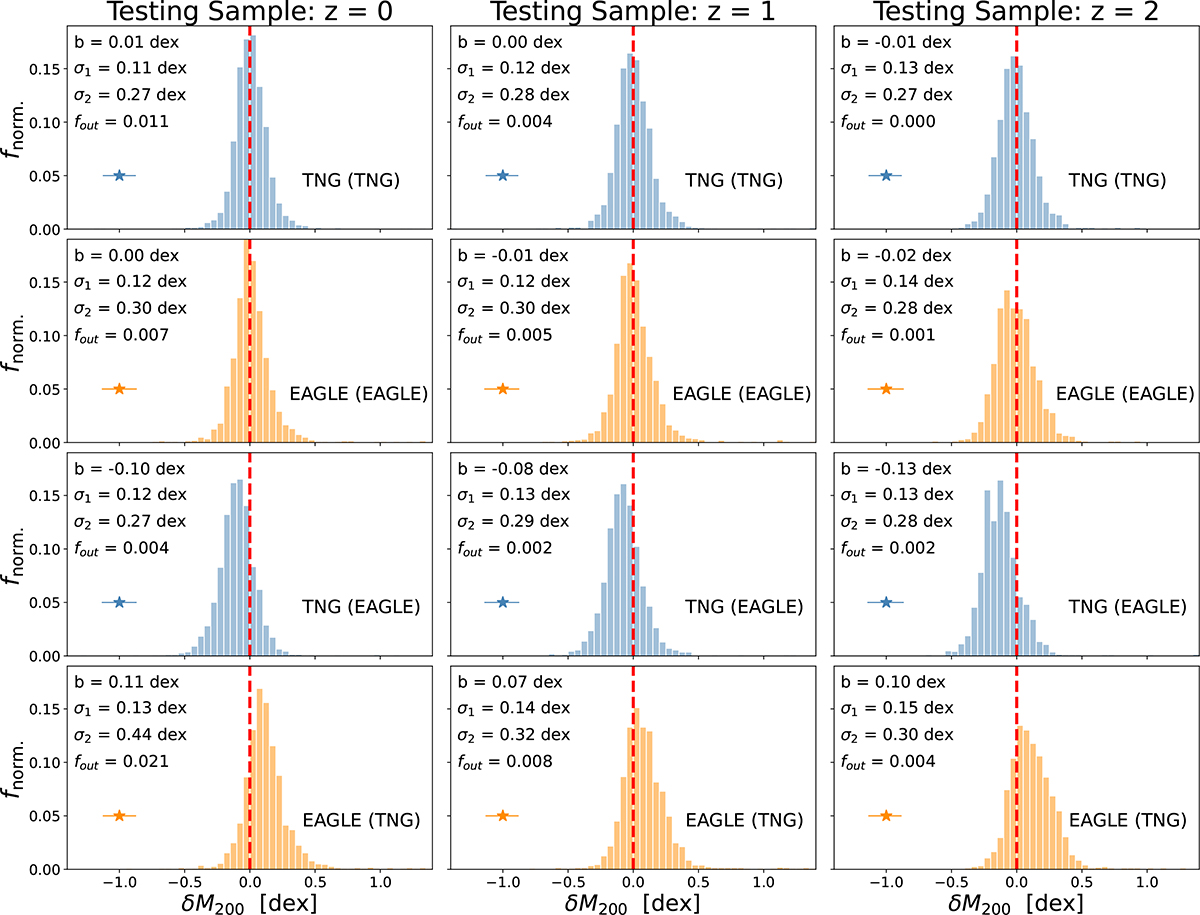
Fig. 7.
Download original image
Halo mass recovery performance with DfL IIa: Distributions in the offset from true-to-predicted M200 values (δM200 ≡ M200 (true)− M200 (predicted)). The structure of this figure is identical to Fig. 6. In each panel a dashed red line shows the perfect regression value of δM200 = 0, and the mean uncertainty on halo masses output from DfL is indicated by a horizontal error bar. Additionally, the bias (median offset), full 1σ dispersion (σ1, containing 68% of the data set), 2σ dispersion (σ2, containing 95% of the data), and the fraction of catastrophic outliers (those with |δM200|> 1 dex) are indicated in each panel. For the cases of data and models being matched (top two rows), the pipeline recovers halo masses with essentially no bias (|b|≤0.02 dex) and an average uncertainty of ⟨σ1⟩=0.12 dex. To test the impact of model uncertainty, in the lower two rows we show the δM200 distributions for TNG data with an EAGLE model, and vice versa. Here an average bias of ⟨b⟩= − 0.10 dex is found by applying the EAGLE model to TNG data, and an average bias of ⟨b⟩= + 0.10 dex is found by applying the TNG model to EAGLE data. The overall random uncertainty remains essentially unchanged.
Current usage metrics show cumulative count of Article Views (full-text article views including HTML views, PDF and ePub downloads, according to the available data) and Abstracts Views on Vision4Press platform.
Data correspond to usage on the plateform after 2015. The current usage metrics is available 48-96 hours after online publication and is updated daily on week days.
Initial download of the metrics may take a while.