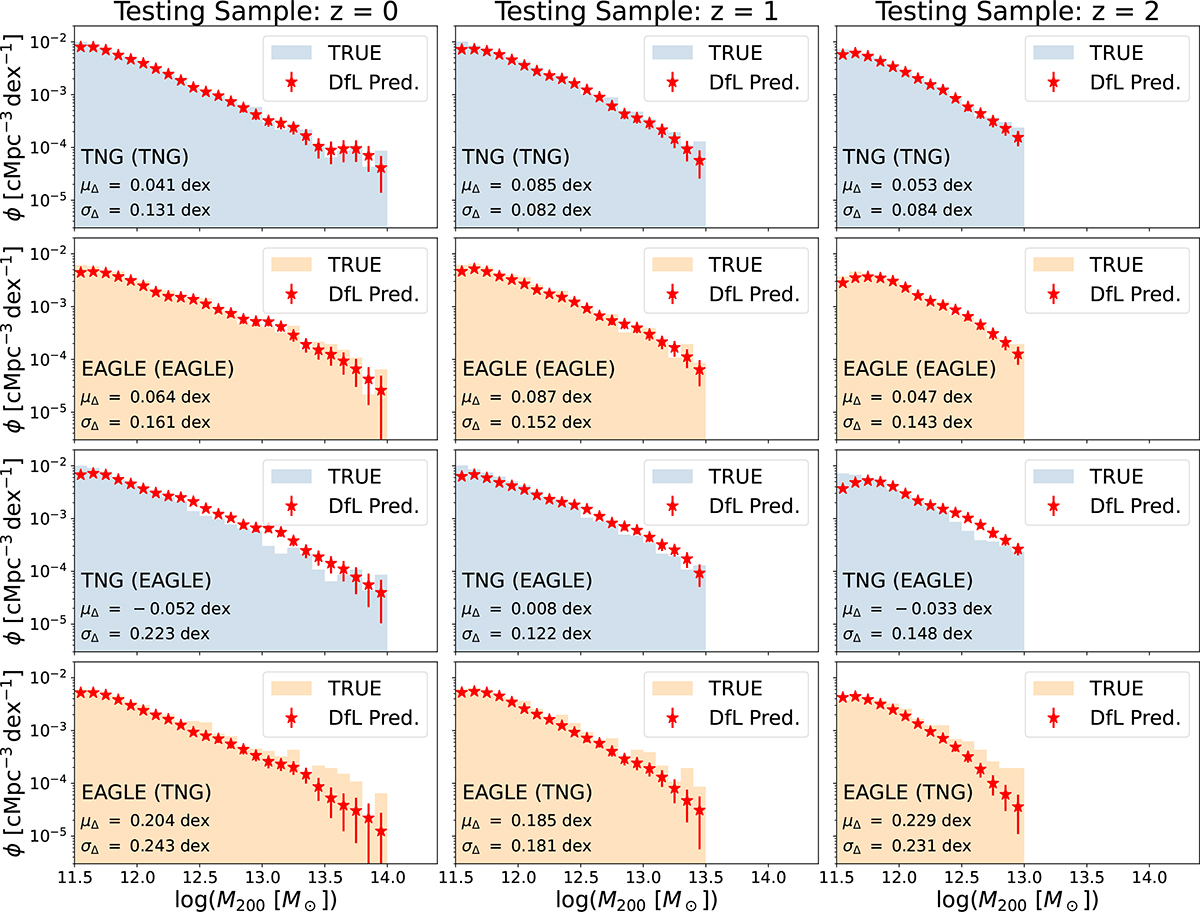
Fig. 9.
Download original image
Halo mass recovery performance with DfL III: Halo mass functions. This figure is structured as in Figs. 6 and 7. In each panel the actual halo mass function for the simulation at each epoch (shaded regions) and the estimated halo mass function from the DfL pipeline (data points with errors) are compared. In the case of applying the same model and data pairing (albeit trained and tested on different subsamples), there is excellent agreement between the two distributions. In the case of applying different model and data pairings, there is more noticeable disagreement, originating from the differences in the true halo mass functions between simulations. Therefore, one can recover the halo mass function as it would be in either simulation from observational-like data to high fidelity, but the output halo mass function will be biased by the model choice. Additionally, in each panel we show the mean offset and standard deviation in offsets between the mass functions in order to quantify the statistical difference, and to facilitate comparison to the FOF-AM approach (see Section 4.4).
Current usage metrics show cumulative count of Article Views (full-text article views including HTML views, PDF and ePub downloads, according to the available data) and Abstracts Views on Vision4Press platform.
Data correspond to usage on the plateform after 2015. The current usage metrics is available 48-96 hours after online publication and is updated daily on week days.
Initial download of the metrics may take a while.