Fig. 10.
Download original image
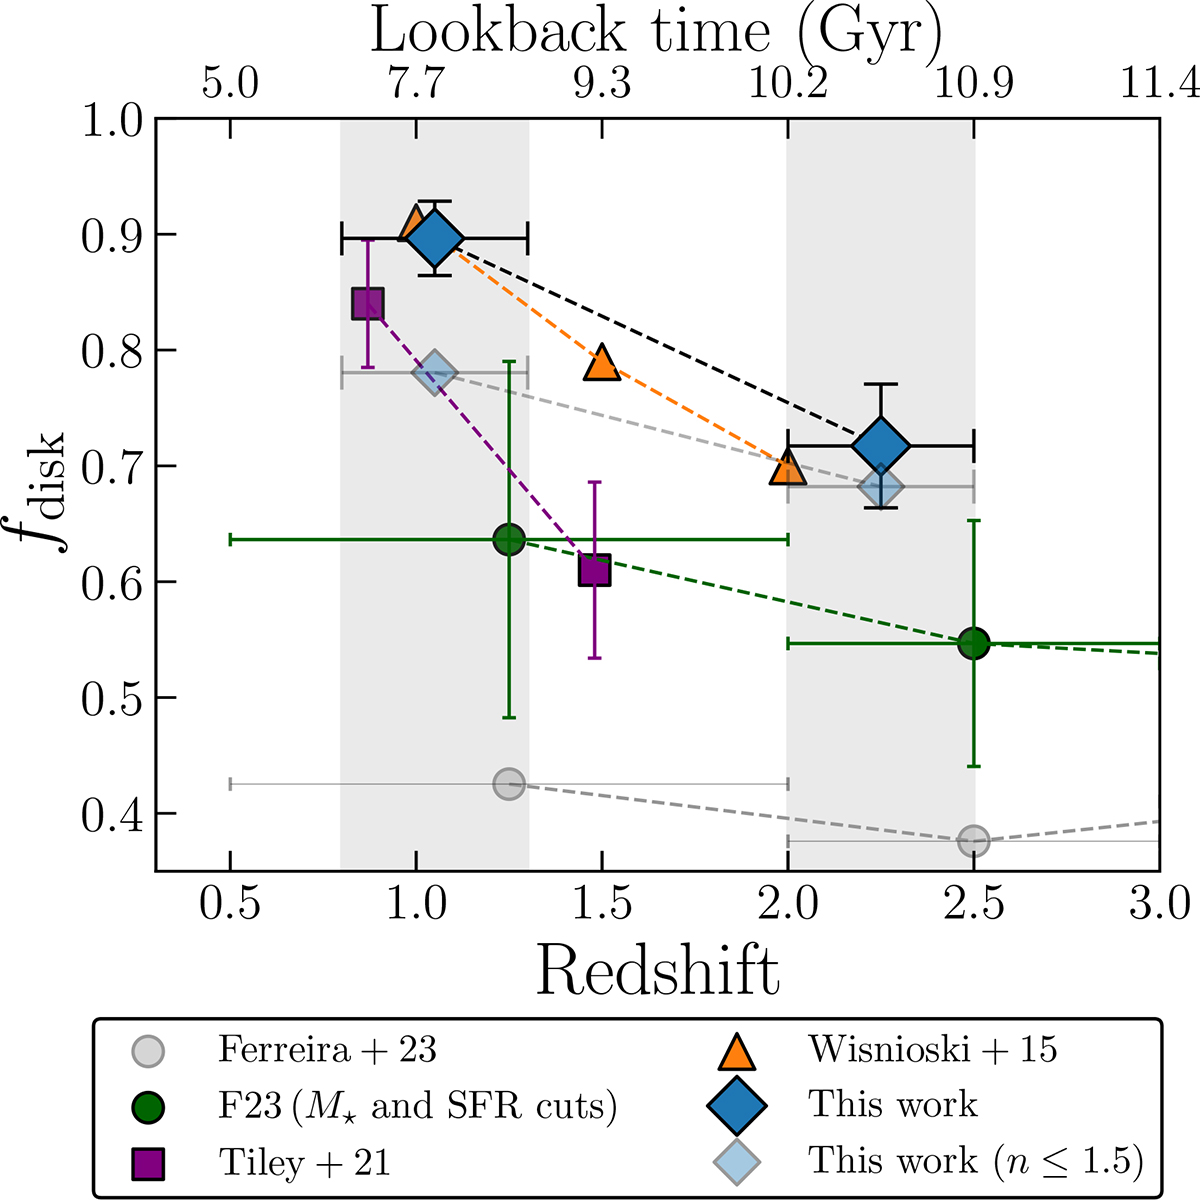
Disk fractions, fdisk = Ndisk/Ntotal, as a function of redshift. The dark blue diamonds represent the results from our visual classifications. The light blue diamonds indicate disk fractions when an additional Sérsic index threshold of n ≤ 1.5 is applied. For comparison, the orange triangles indicate disk fractions from the kinematic analysis of Wisnioski et al. (2015), while the purple squares show measurements from Tiley et al. (2021). The green circles represent disk fractions for the subset of the 3D-HST galaxies in Ferreira et al. (2023) (F23) that overlap with our sample and satisfy our M⋆ & SFR selection criteria. The gray circles correspond to the unfiltered but still overlapping sample of F23. The gray-shaded regions indicate the redshift bins analyzed in this study.
Current usage metrics show cumulative count of Article Views (full-text article views including HTML views, PDF and ePub downloads, according to the available data) and Abstracts Views on Vision4Press platform.
Data correspond to usage on the plateform after 2015. The current usage metrics is available 48-96 hours after online publication and is updated daily on week days.
Initial download of the metrics may take a while.