Fig. 13.
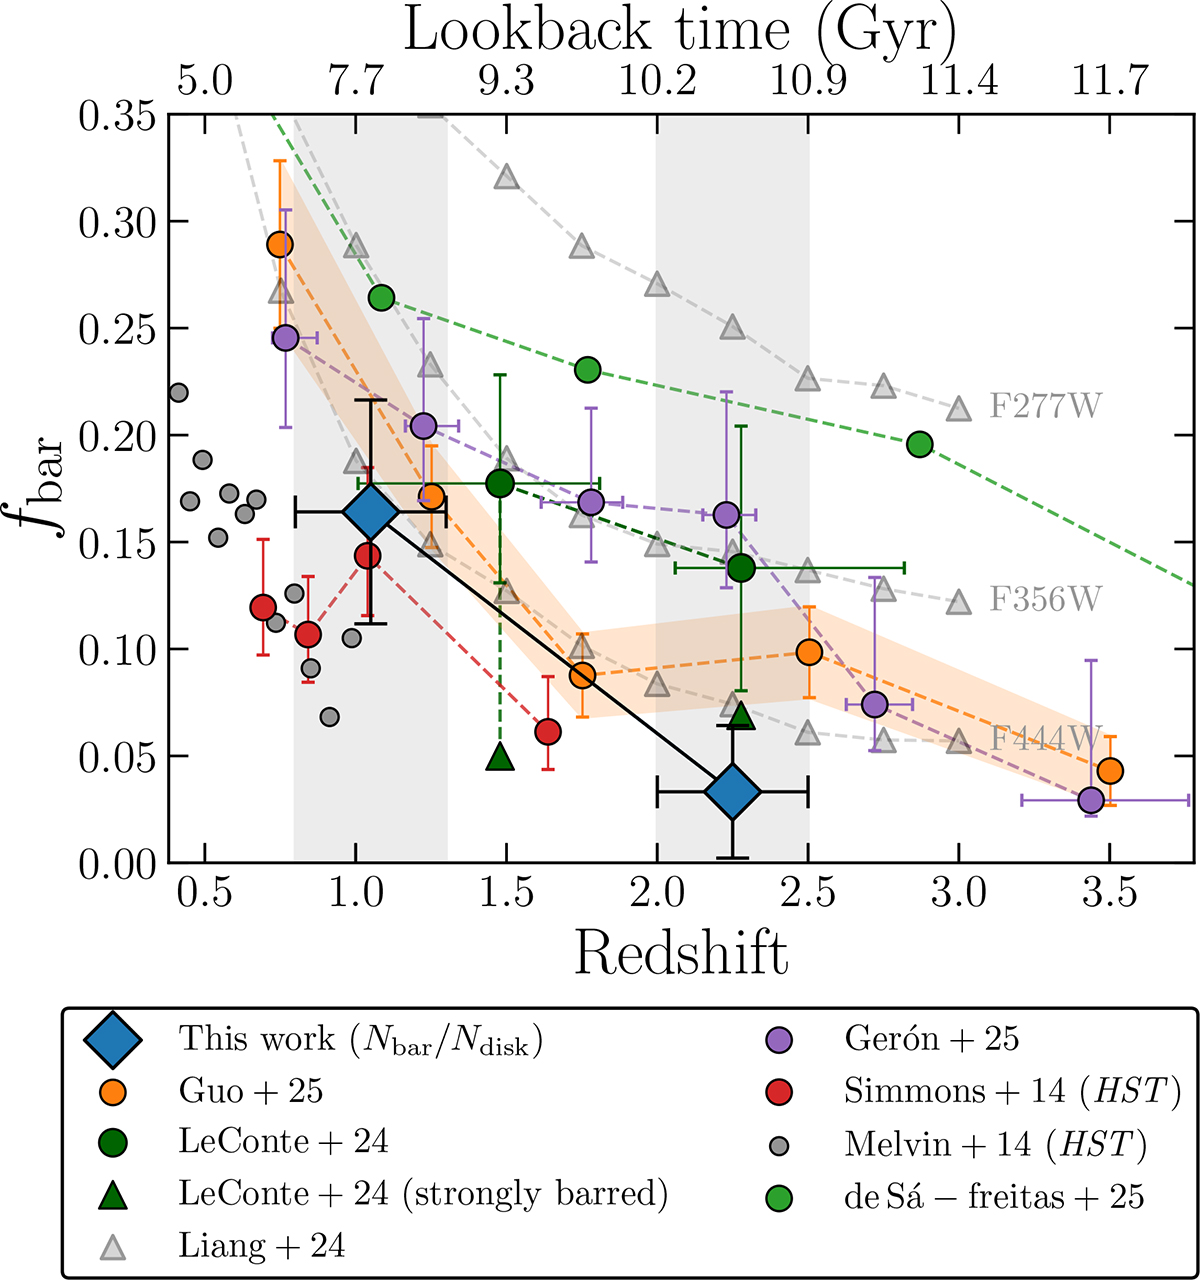
Download original image
Bar fractions (fbar = Nbar/Ndisk) from the subsample of disks with e < 0.5 where the isophotal fitting analysis is reliable. The orange dots show the results from Guo et al. (2025), while the green dots correspond to the fractions inferred by Le Conte et al. (2024), where the green triangles indicate the fractions inferred using only their sample of strongly barred galaxies. The purple dots indicate the Galaxy-Zoo based measurements from Géron et al. (2025) using JWST-NIRCam imaging. The gray triangles represent simulated bar fractions from Liang et al. (2024) for a set of JWST filters, given an intrinsic fbar of 0.68 at z ≈ 0. Finally, the red and gray dots indicate the HST-based bar fractions from Simmons et al. (2014) and Melvin et al. (2014), respectively.
Current usage metrics show cumulative count of Article Views (full-text article views including HTML views, PDF and ePub downloads, according to the available data) and Abstracts Views on Vision4Press platform.
Data correspond to usage on the plateform after 2015. The current usage metrics is available 48-96 hours after online publication and is updated daily on week days.
Initial download of the metrics may take a while.