Fig. 14.
Download original image
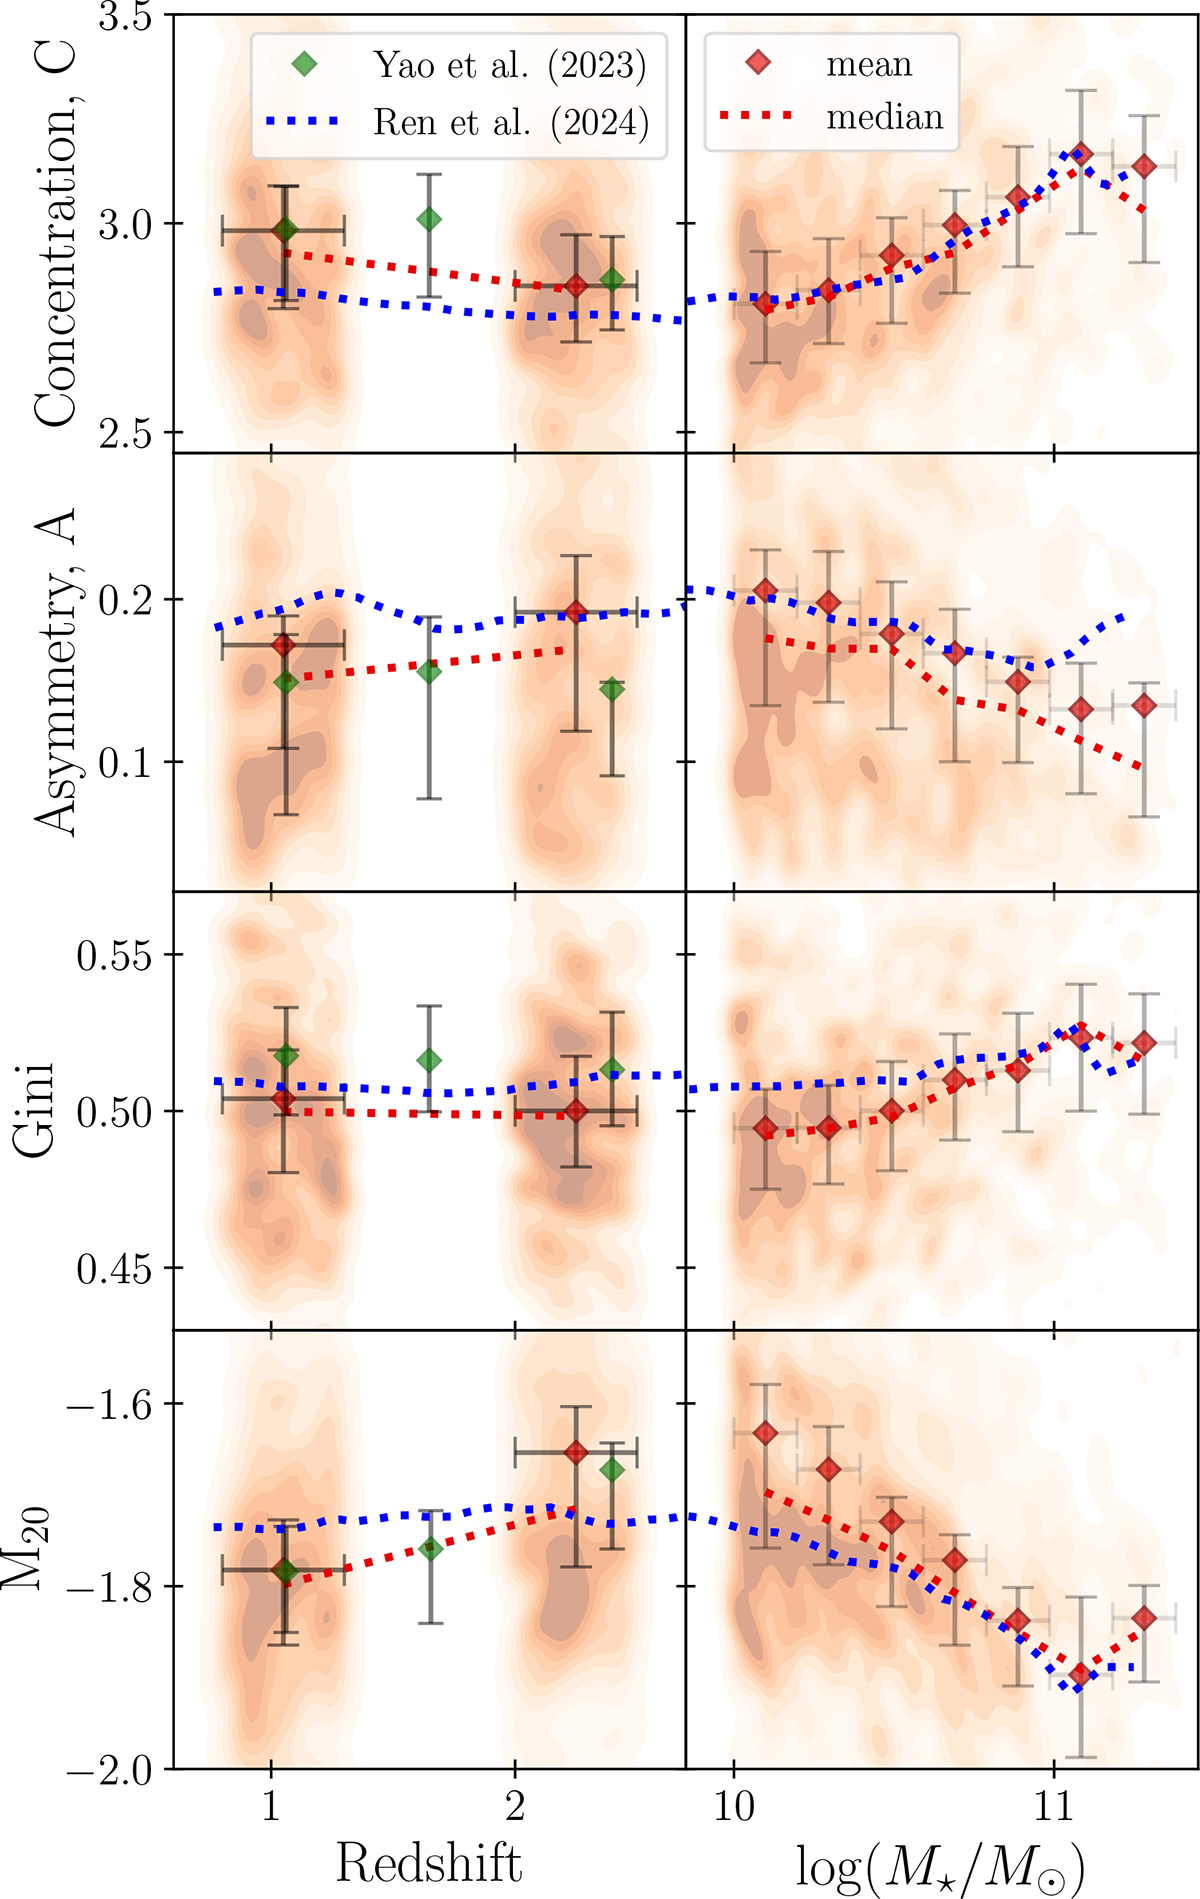
Morphological statistics of galaxies across redshift (left column) and stellar mass (right column). From top to bottom: Concentration (C), asymmetry (A), Gini, and M20 indices. Our results are presented as mean values (diamonds) and medians (horizontal markers). For comparison, we include the trends reported by Yao et al. (2023) (green diamonds) over the range 0.8 < z < 3 and Ren et al. (2024) (blue dotted lines) for 0.5 < z < 3. Our error bars indicate the central 34% range (spanning the 33rd to 67th percentiles) to ensure consistency with the results of Yao et al. (2023) The values from Ren et al. (2024) were originally adjusted for observational effects, such as noise and finite PSF resolution, using a correction formula. To ensure a consistent comparison with our F444W-matched galaxy sample, we reverse-applied their correction formula to de-adjust their values, aligning them with the observational conditions in our work and those by Yao et al. (2023) We find a strong agreement between our results and those of Yao et al. (2023) and Ren et al. (2024), highlighting the consistency across studies.
Current usage metrics show cumulative count of Article Views (full-text article views including HTML views, PDF and ePub downloads, according to the available data) and Abstracts Views on Vision4Press platform.
Data correspond to usage on the plateform after 2015. The current usage metrics is available 48-96 hours after online publication and is updated daily on week days.
Initial download of the metrics may take a while.