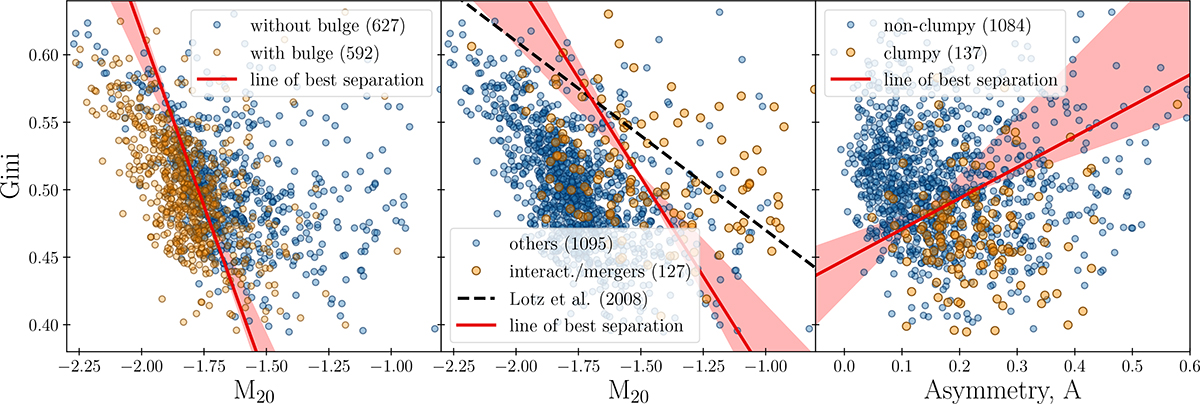
Fig. 15.
Download original image
Notable parameter spaces where the combination of morphological metrics separate well different morphologies. In each panel, the red line corresponds to the line of best separation, which corresponds to the minimal contamination 𝒞min (defined in Appendix C), and the light red area indicates other possible line positions which achieve contamination within 0.01 of the minimal contamination, i.e., C ∈ (𝒞min, 𝒞min + 0.01). Left: Gini vs. M20 plane for galaxies with and without bulges. The line G = −0.52M20 − 0.4, separates the main cluster of galaxies with bulges (71%) and those without bulges (74%). Middle: Gini vs. M20 plane for galaxies identified as interacting/mergers. The line G = −0.29M20 + 0.07 (red) shows a systematic separation of the cluster of data points in this parameter space, with 50% of visually classified mergers and 93% of nonmergers correctly separated. For comparison, we show with the black dashed line the boundary line established by Lotz et al. (2008) and discuss the difference in the main text. Right: Gini vs. asymmetry A plane for clumpy and nonclumpy galaxies. The separation line is given by G = 0.229A + 0.448, where 81.8% of clumpy galaxies are below the line and 64.1% of the nonclumpy galaxies are above.
Current usage metrics show cumulative count of Article Views (full-text article views including HTML views, PDF and ePub downloads, according to the available data) and Abstracts Views on Vision4Press platform.
Data correspond to usage on the plateform after 2015. The current usage metrics is available 48-96 hours after online publication and is updated daily on week days.
Initial download of the metrics may take a while.