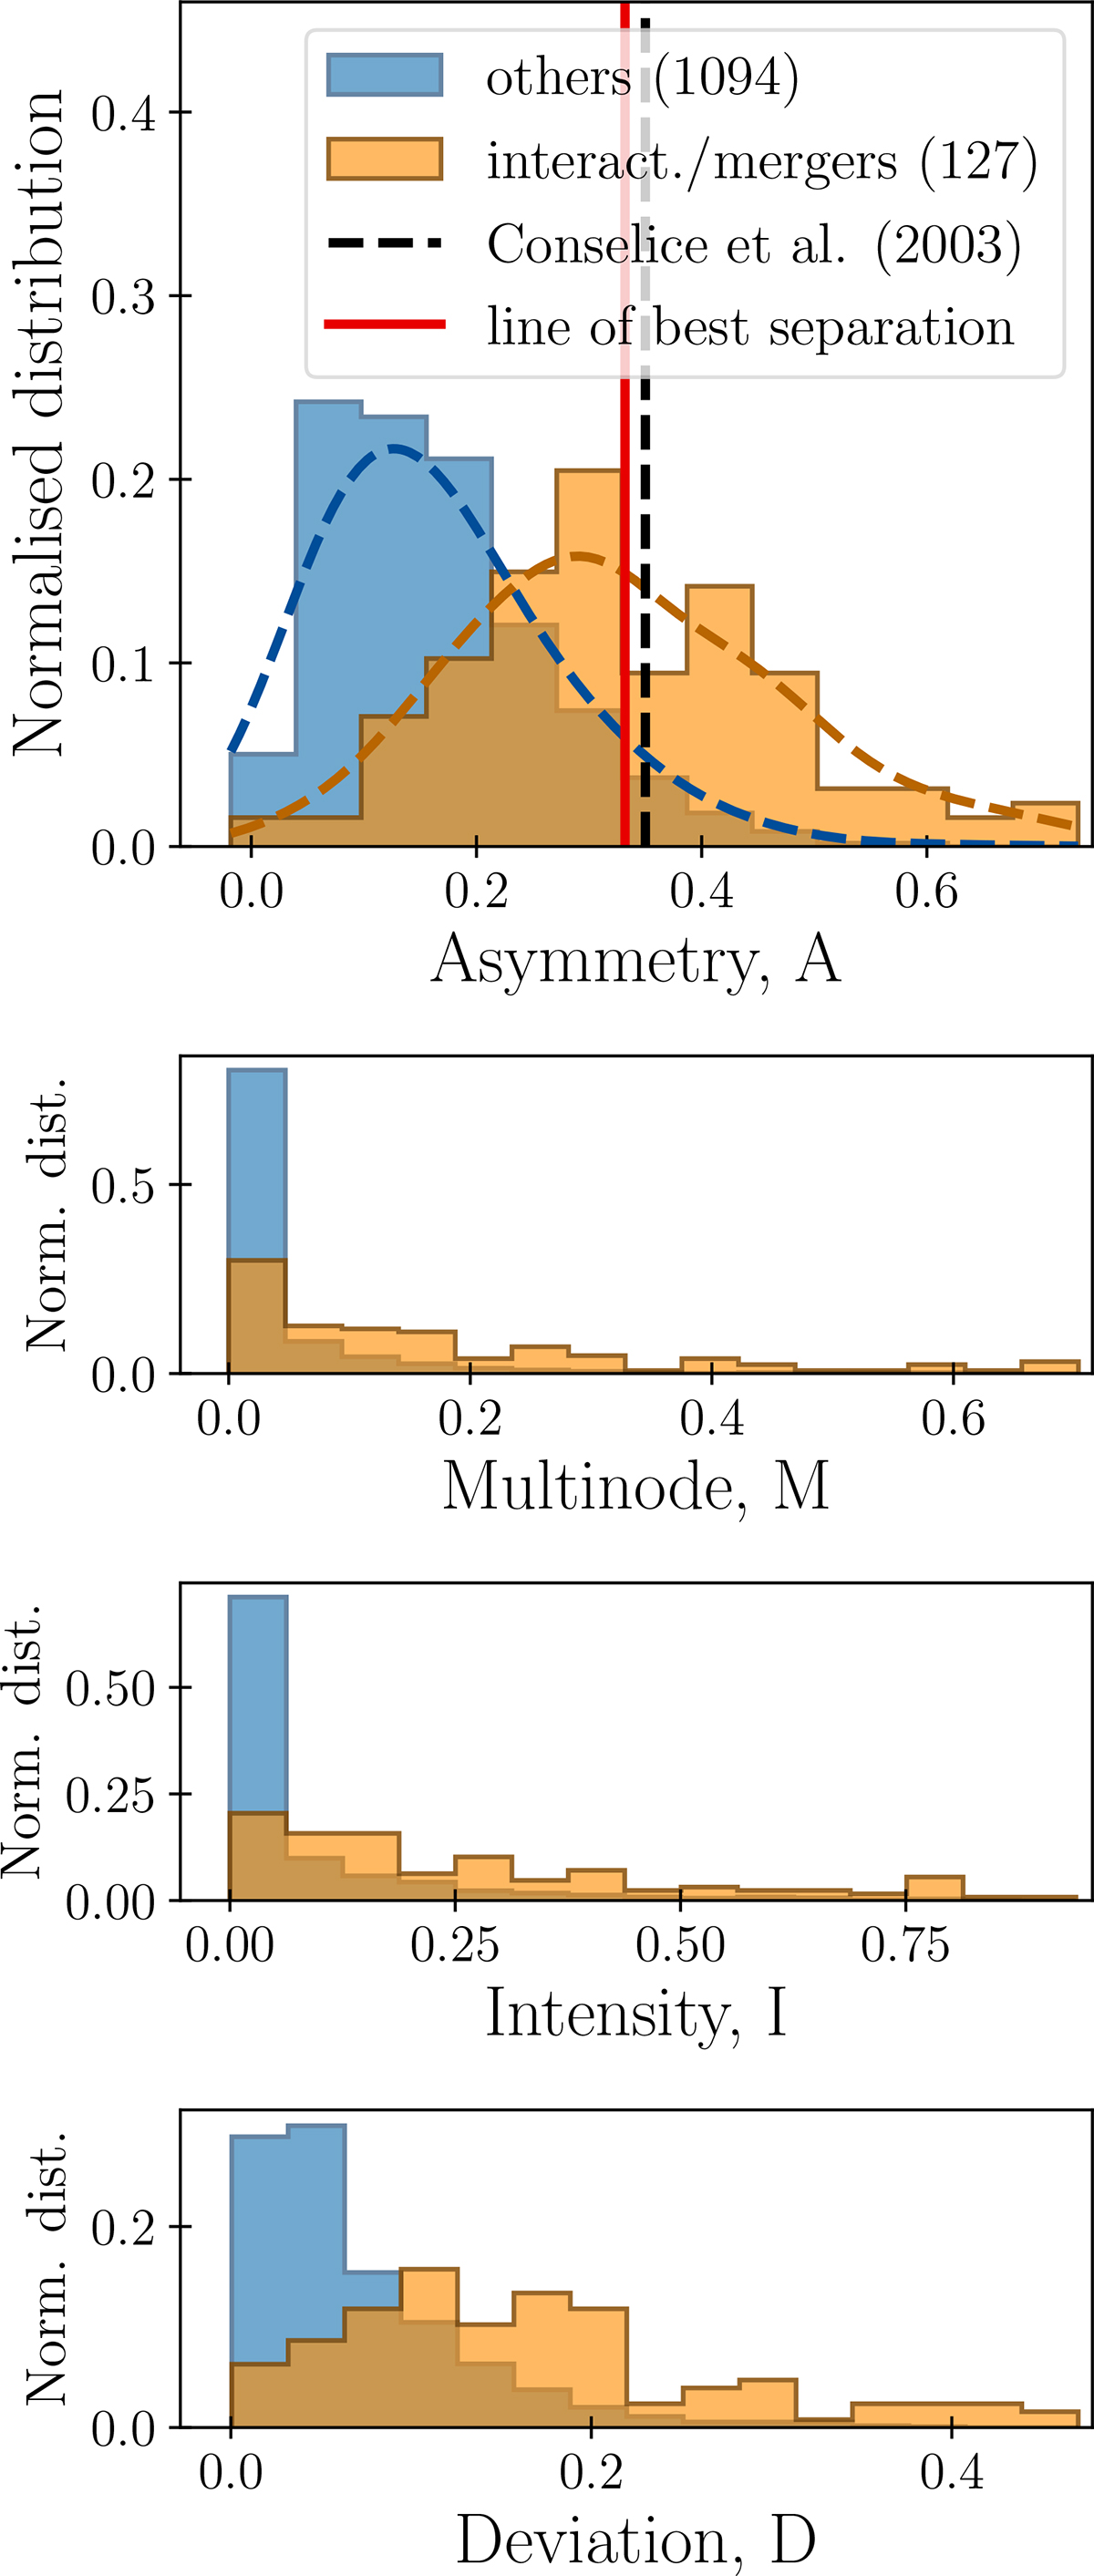
Fig. 16.
Download original image
Top panel: Distribution of the asymmetry statistics (A in CAS) in our sample. The statistics show a clear systematic separation around value A = 0.23. Maintaining a merger fraction of ≈10%, we obtained the vertical red line A = 0.332 that separates 44% of mergers and 93% of nonmergers, with only a minor offset from the boundary line of A = 0.35 introduced by Conselice (2003). Bottom three panels: Multinode, intensity, and deviation (MID) statistics. They reveal systematic differences in distributions between visually classified mergers and nonmergers, as expected, given their design to capture morphological features of disturbed systems.
Current usage metrics show cumulative count of Article Views (full-text article views including HTML views, PDF and ePub downloads, according to the available data) and Abstracts Views on Vision4Press platform.
Data correspond to usage on the plateform after 2015. The current usage metrics is available 48-96 hours after online publication and is updated daily on week days.
Initial download of the metrics may take a while.