Fig. 17.
Download original image
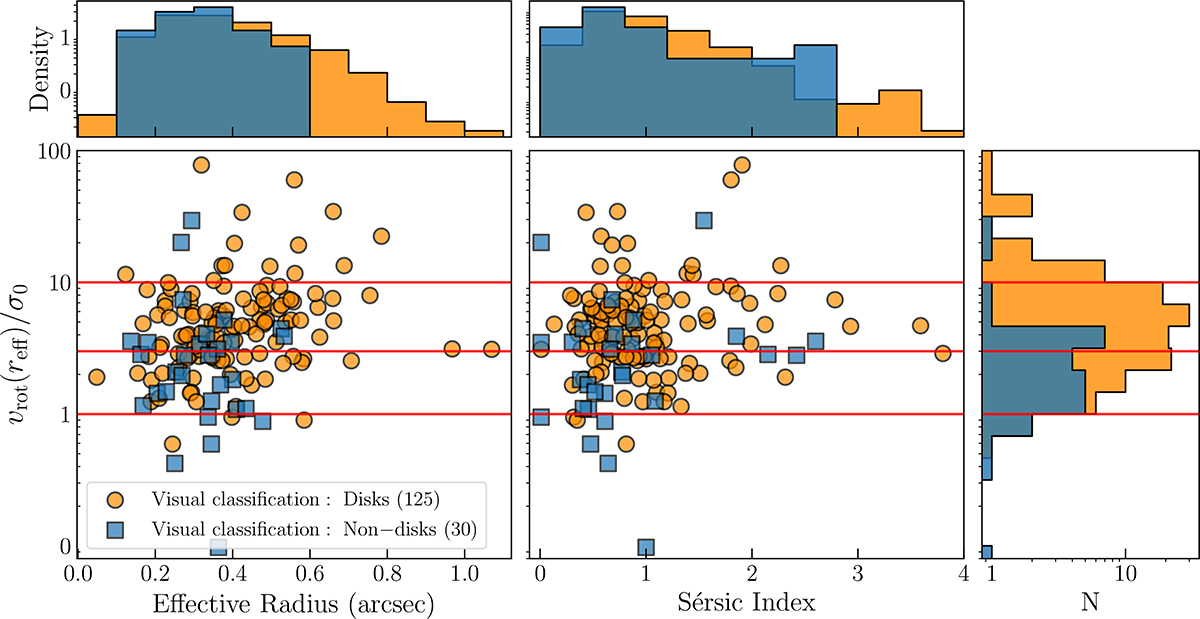
Scatter plots of vrot(reff)/σ0 as a function of effective radius (left) and Sérsic index (right) for disk (orange circles) and nondisk (blue squares) galaxies. The histograms above each panel show the normalized distributions of effective radius and Sérsic index, while the histogram on the right represents the distribution of vrot(reff)/σ0. The red horizontal lines indicate reference values at vrot(reff)/σ0 = 1, 3, and 10.
Current usage metrics show cumulative count of Article Views (full-text article views including HTML views, PDF and ePub downloads, according to the available data) and Abstracts Views on Vision4Press platform.
Data correspond to usage on the plateform after 2015. The current usage metrics is available 48-96 hours after online publication and is updated daily on week days.
Initial download of the metrics may take a while.