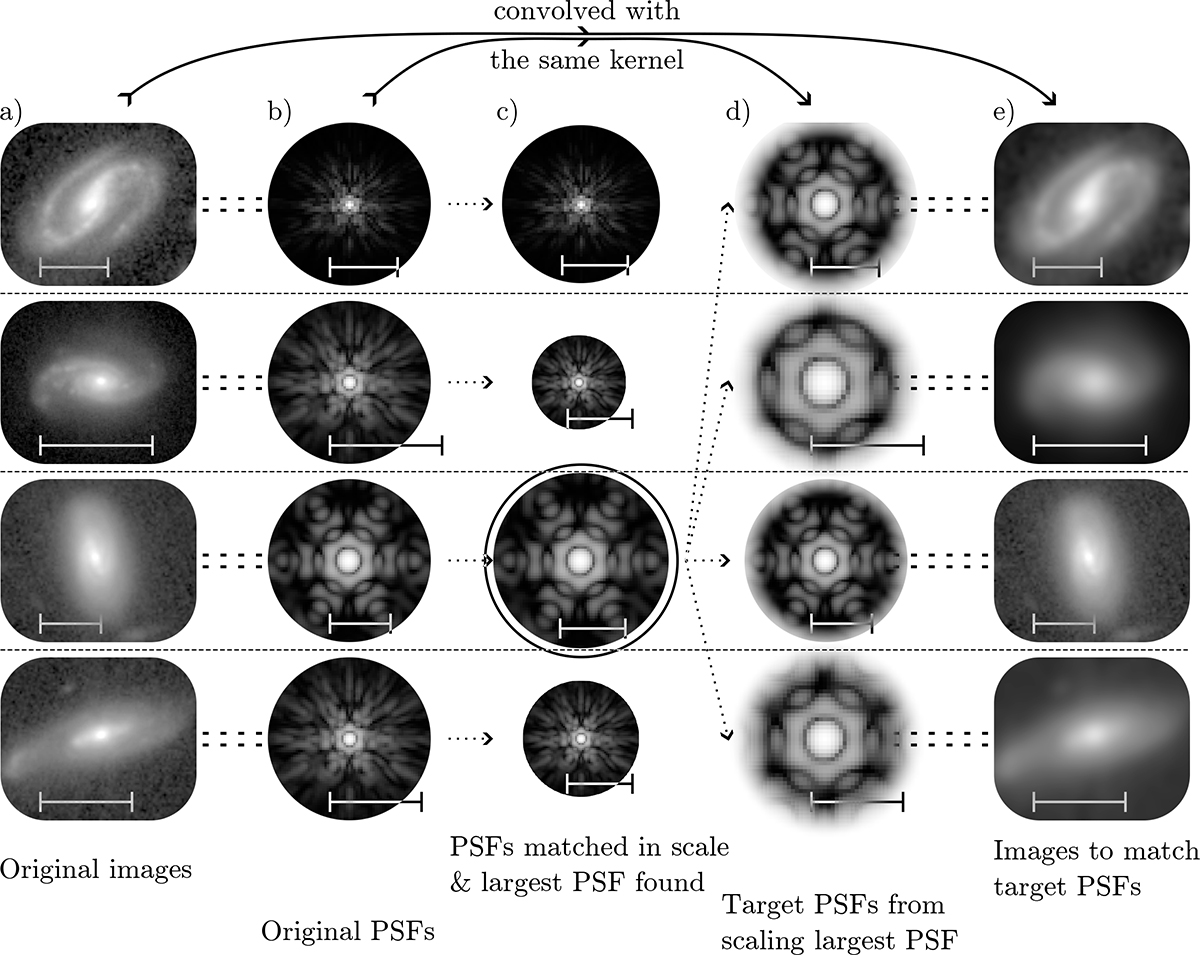
Fig. B.2.
Download original image
Illustration of the method used to match the spatial resolution of galaxy images across the sample, so that all galaxies appear as they would under identical observing conditions. (a) Original images: Initial galaxy images, with a 2 kpc horizontal scale bar indicating their physical size at the galaxy’s redshift. (b) Original PSFs: The point spread functions (PSFs) corresponding to each image. (c) Scaling the PSFs: To enable a fair comparison, PSFs are rescaled to represent physical sizes (kpc) consistently. The FWHM of each PSF is measured, and the galaxy with the largest PSF is identified. In this case, the largest PSF corresponds to a galaxy at z = 2 observed with the F444W filter, with a PSF width of 1.19 kpc. (d) Creating target PSFs: The largest PSF from (c) is used as a reference. It is rescaled to match each galaxy’s physical size while maintaining a constant FWHM in spatial units. This ensures that all PSFs correspond to the same physical resolution across the sample. This is evident in the main PSF component, which spans a fixed fraction (approximately half) of the horizontal scale bar across all images. (e) Final image matching: Each original image (from panel a) is convolved with a kernel derived from the rescaled PSFs (panel d). This convolution results in a final set of images that all share the same spatial resolution, making them directly comparable.
Current usage metrics show cumulative count of Article Views (full-text article views including HTML views, PDF and ePub downloads, according to the available data) and Abstracts Views on Vision4Press platform.
Data correspond to usage on the plateform after 2015. The current usage metrics is available 48-96 hours after online publication and is updated daily on week days.
Initial download of the metrics may take a while.