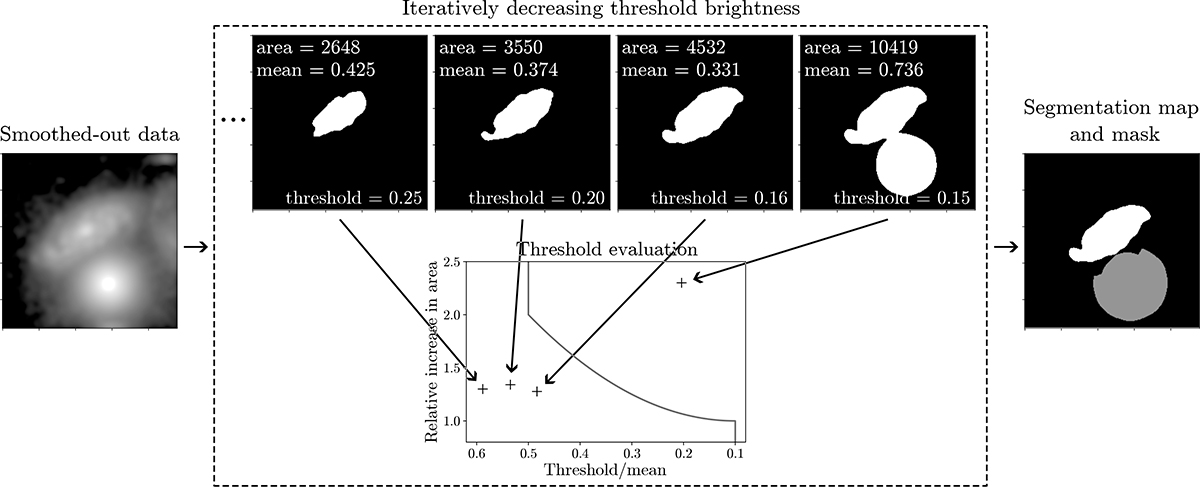
Fig. B.3.
Download original image
Illustration of the iterative process used to determine the brightness threshold for constructing the segmentation map. We start by smoothing out the image data with a 10-pixel-wide Gaussian. Then, at each step, the brightness threshold is decreased incrementally, and the impact is assessed by examining (1) the relative increase in the area enclosed by the threshold (y-axis) and (2) the ratio of the threshold value to the mean brightness within the enclosed area (x-axis). The threshold is deemed sufficiently low when the target object can be distinguished from other objects in the image, which is determined by whether the cutoff curve (gray) has been crossed in this parameter space. The optimal shape of the cutoff curve was established through manual evaluation of a randomly selected subset of the sample.
Current usage metrics show cumulative count of Article Views (full-text article views including HTML views, PDF and ePub downloads, according to the available data) and Abstracts Views on Vision4Press platform.
Data correspond to usage on the plateform after 2015. The current usage metrics is available 48-96 hours after online publication and is updated daily on week days.
Initial download of the metrics may take a while.