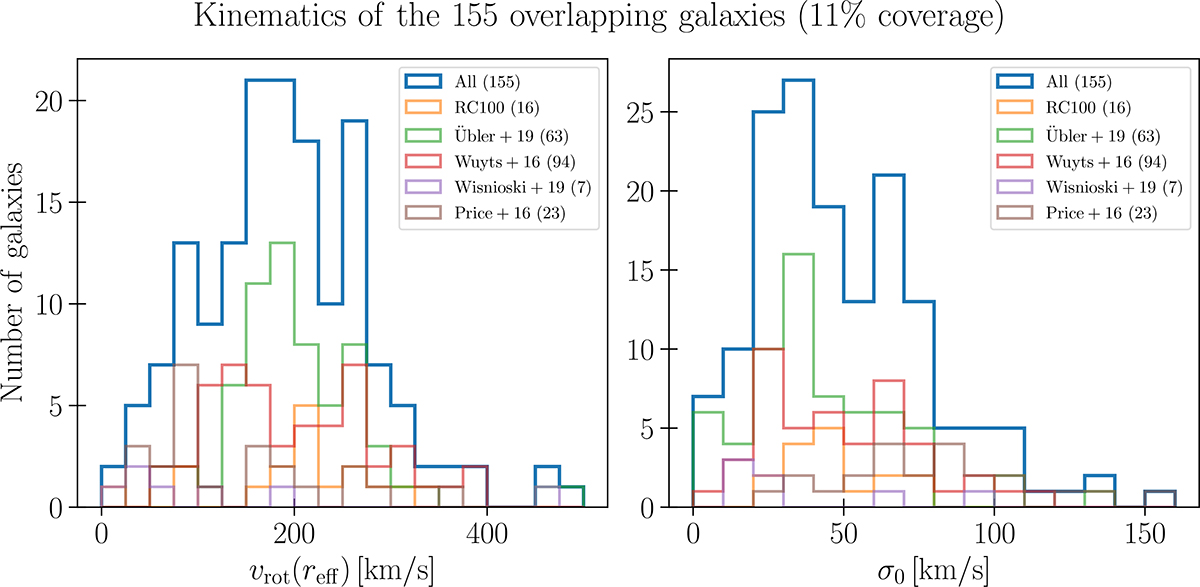
Fig. 3.
Download original image
Histograms showing the distribution of rotational velocity vrot(reff) (left) and velocity dispersion σ0 (right) for different galaxy samples including the RC100 (Nestor Shachar et al. 2023), and those from Übler et al. (2019), Wuyts et al. (2016), Wisnioski et al. (2019), and Price et al. (2016). The legend indicates the corresponding dataset and includes the number of galaxies in each sample (in parentheses). The “All” sample (blue) represents the full dataset; the other colors correspond to specific subsamples from various studies.
Current usage metrics show cumulative count of Article Views (full-text article views including HTML views, PDF and ePub downloads, according to the available data) and Abstracts Views on Vision4Press platform.
Data correspond to usage on the plateform after 2015. The current usage metrics is available 48-96 hours after online publication and is updated daily on week days.
Initial download of the metrics may take a while.