Fig. 7.
Download original image
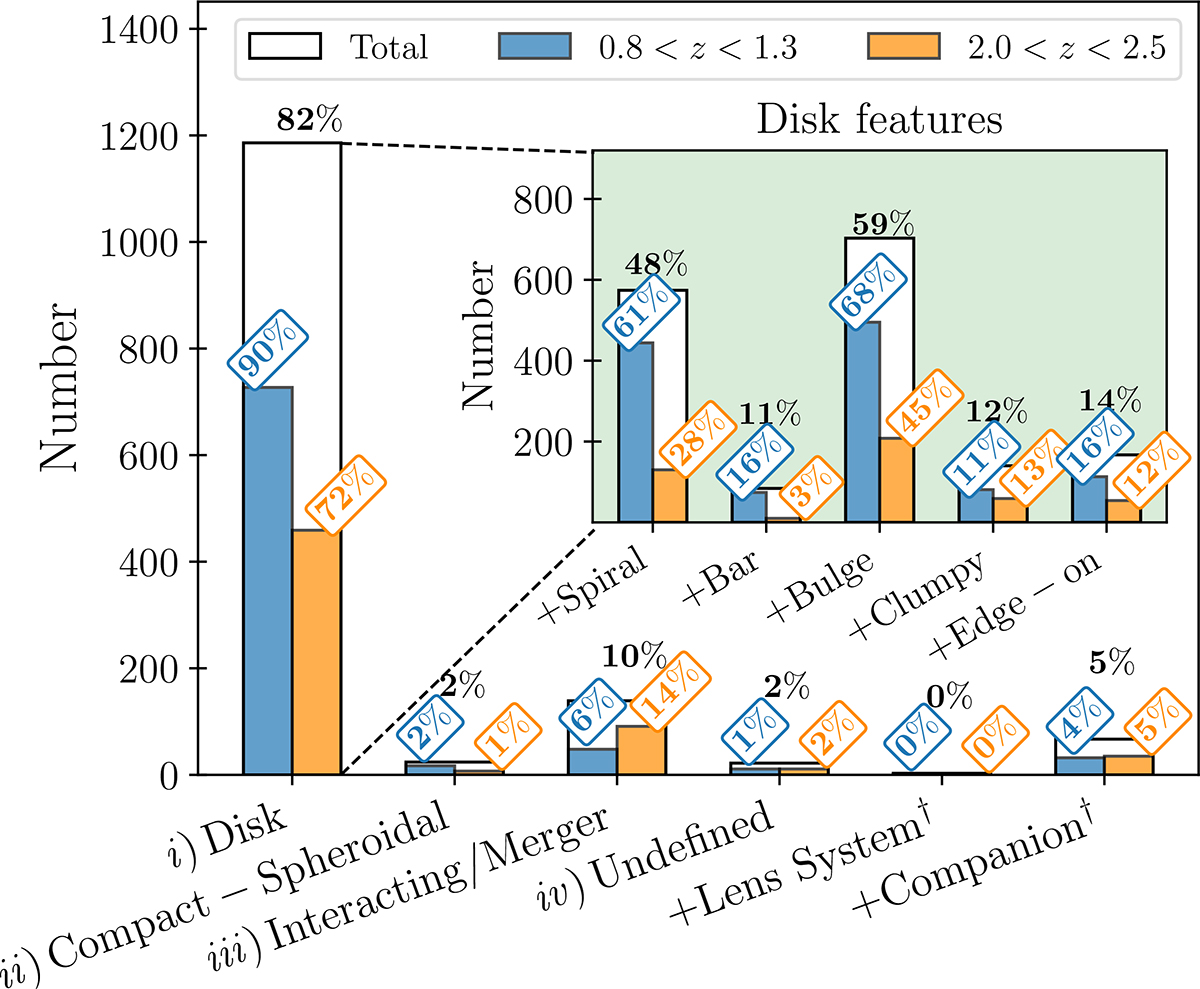
Global classification results for the 1451 galaxies in our sample. The blue and orange bars represent the low- and high-redshift bins, respectively, while the white bars correspond to the full sample. The percentages on top of the bars correspond to fractions normalized by the number of galaxies in the full sample, where black indicates the total, and blue and orange the two redshift bins. While the main text reports fractions with associated uncertainties, we show percentages in this figure to facilitate readability and visual comparison across bins. The inset figure highlights the galaxies classified as disks in the sample, for which we also note the presence of five morphological features. The percentages displayed on top of those bars indicate the fractions of each subcategory normalized by the total number of disks. The † symbol in + Companion denotes a nonmutually exclusive category, meaning it can be assigned alongside any of the main categories.
Current usage metrics show cumulative count of Article Views (full-text article views including HTML views, PDF and ePub downloads, according to the available data) and Abstracts Views on Vision4Press platform.
Data correspond to usage on the plateform after 2015. The current usage metrics is available 48-96 hours after online publication and is updated daily on week days.
Initial download of the metrics may take a while.