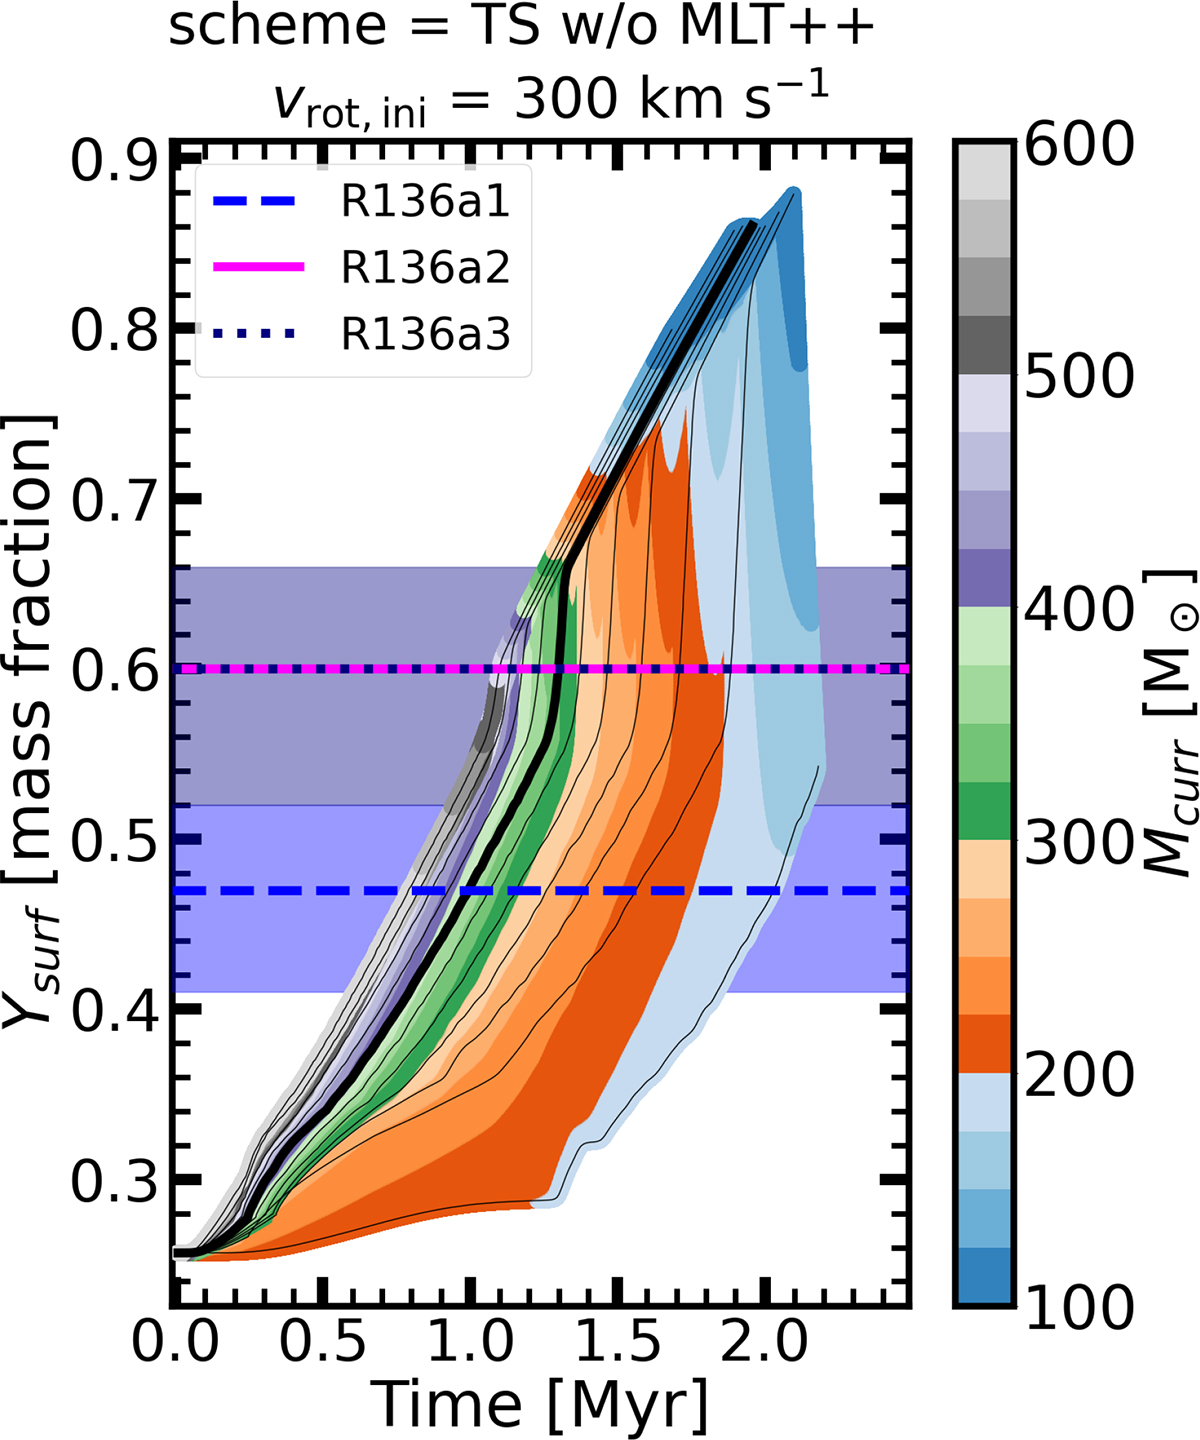
Fig. 10.
Download original image
Surface helium mass fraction as a function of time. The evolutionary models are shown with black lines with decreasing initial mass from left to right. The model with Mini = 500 M⊙ is highlighted with thicker line. The colour-coding shows the interpolated models as a function of their current mass on a logarithmic scale. The observed surface helium mass fractions by Brands et al. 2022 are indicated for the three WNh stars (R136a1 – gray, R136a2 – magenta, R136a3 – navy, see also Table 2). The shaded region shows the associated uncertainty.
Current usage metrics show cumulative count of Article Views (full-text article views including HTML views, PDF and ePub downloads, according to the available data) and Abstracts Views on Vision4Press platform.
Data correspond to usage on the plateform after 2015. The current usage metrics is available 48-96 hours after online publication and is updated daily on week days.
Initial download of the metrics may take a while.