Fig. C.2.
Download original image
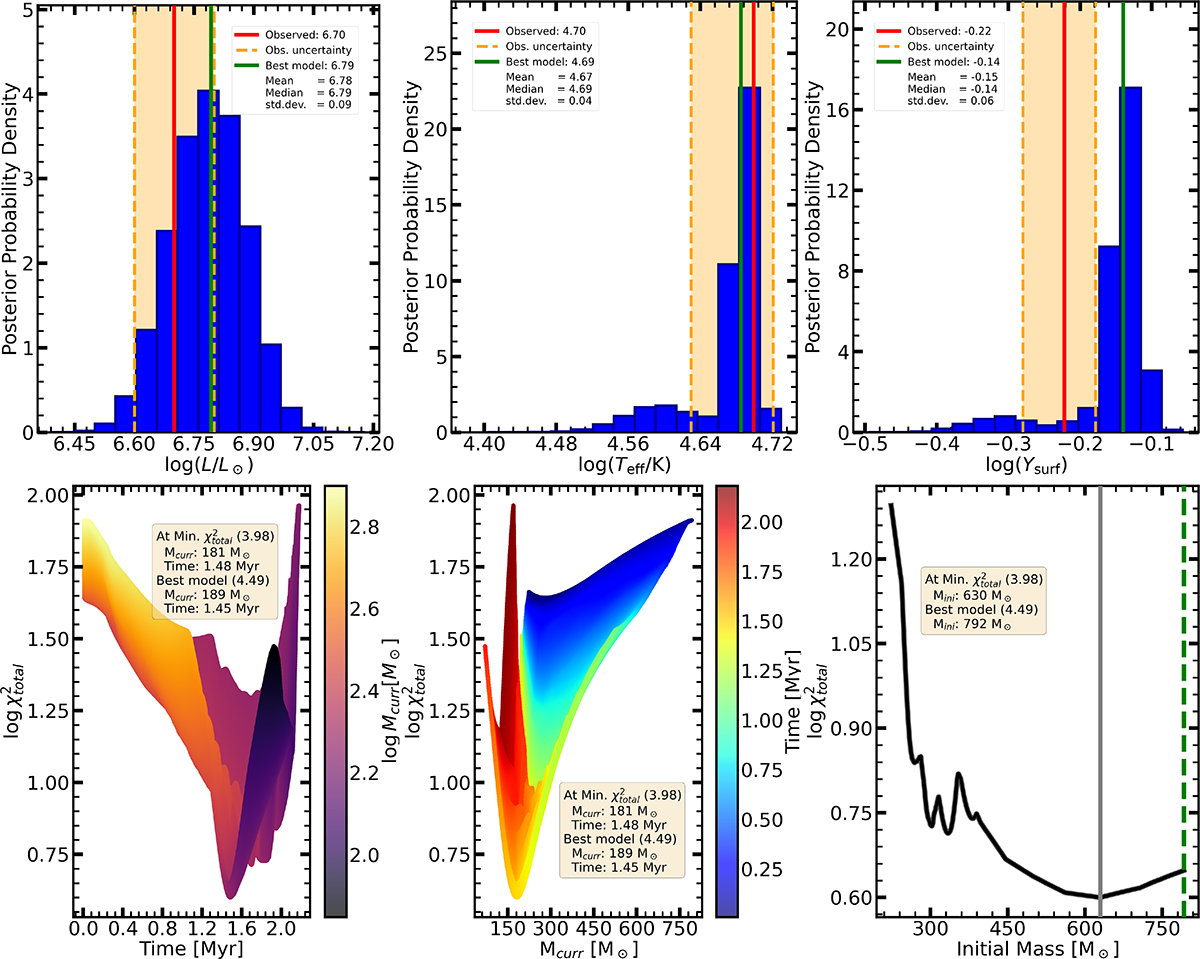
MCMC analysis results for R136a1, considering the TS-300 interpolated grid as an example. The top panels show the individual posterior probability density distributions for the three parameters considered in the analysis. The lower left and middle panels show ![]() as a function of time and current mass (with colour-coding of current mass and time, respectively). The lower right panel shows a
as a function of time and current mass (with colour-coding of current mass and time, respectively). The lower right panel shows a ![]() distribution projected for the initial masses. The grey line corresponds to the lowest
distribution projected for the initial masses. The grey line corresponds to the lowest ![]() value, the green line shows the MAP estimate.
value, the green line shows the MAP estimate.
Current usage metrics show cumulative count of Article Views (full-text article views including HTML views, PDF and ePub downloads, according to the available data) and Abstracts Views on Vision4Press platform.
Data correspond to usage on the plateform after 2015. The current usage metrics is available 48-96 hours after online publication and is updated daily on week days.
Initial download of the metrics may take a while.