Fig. 3.
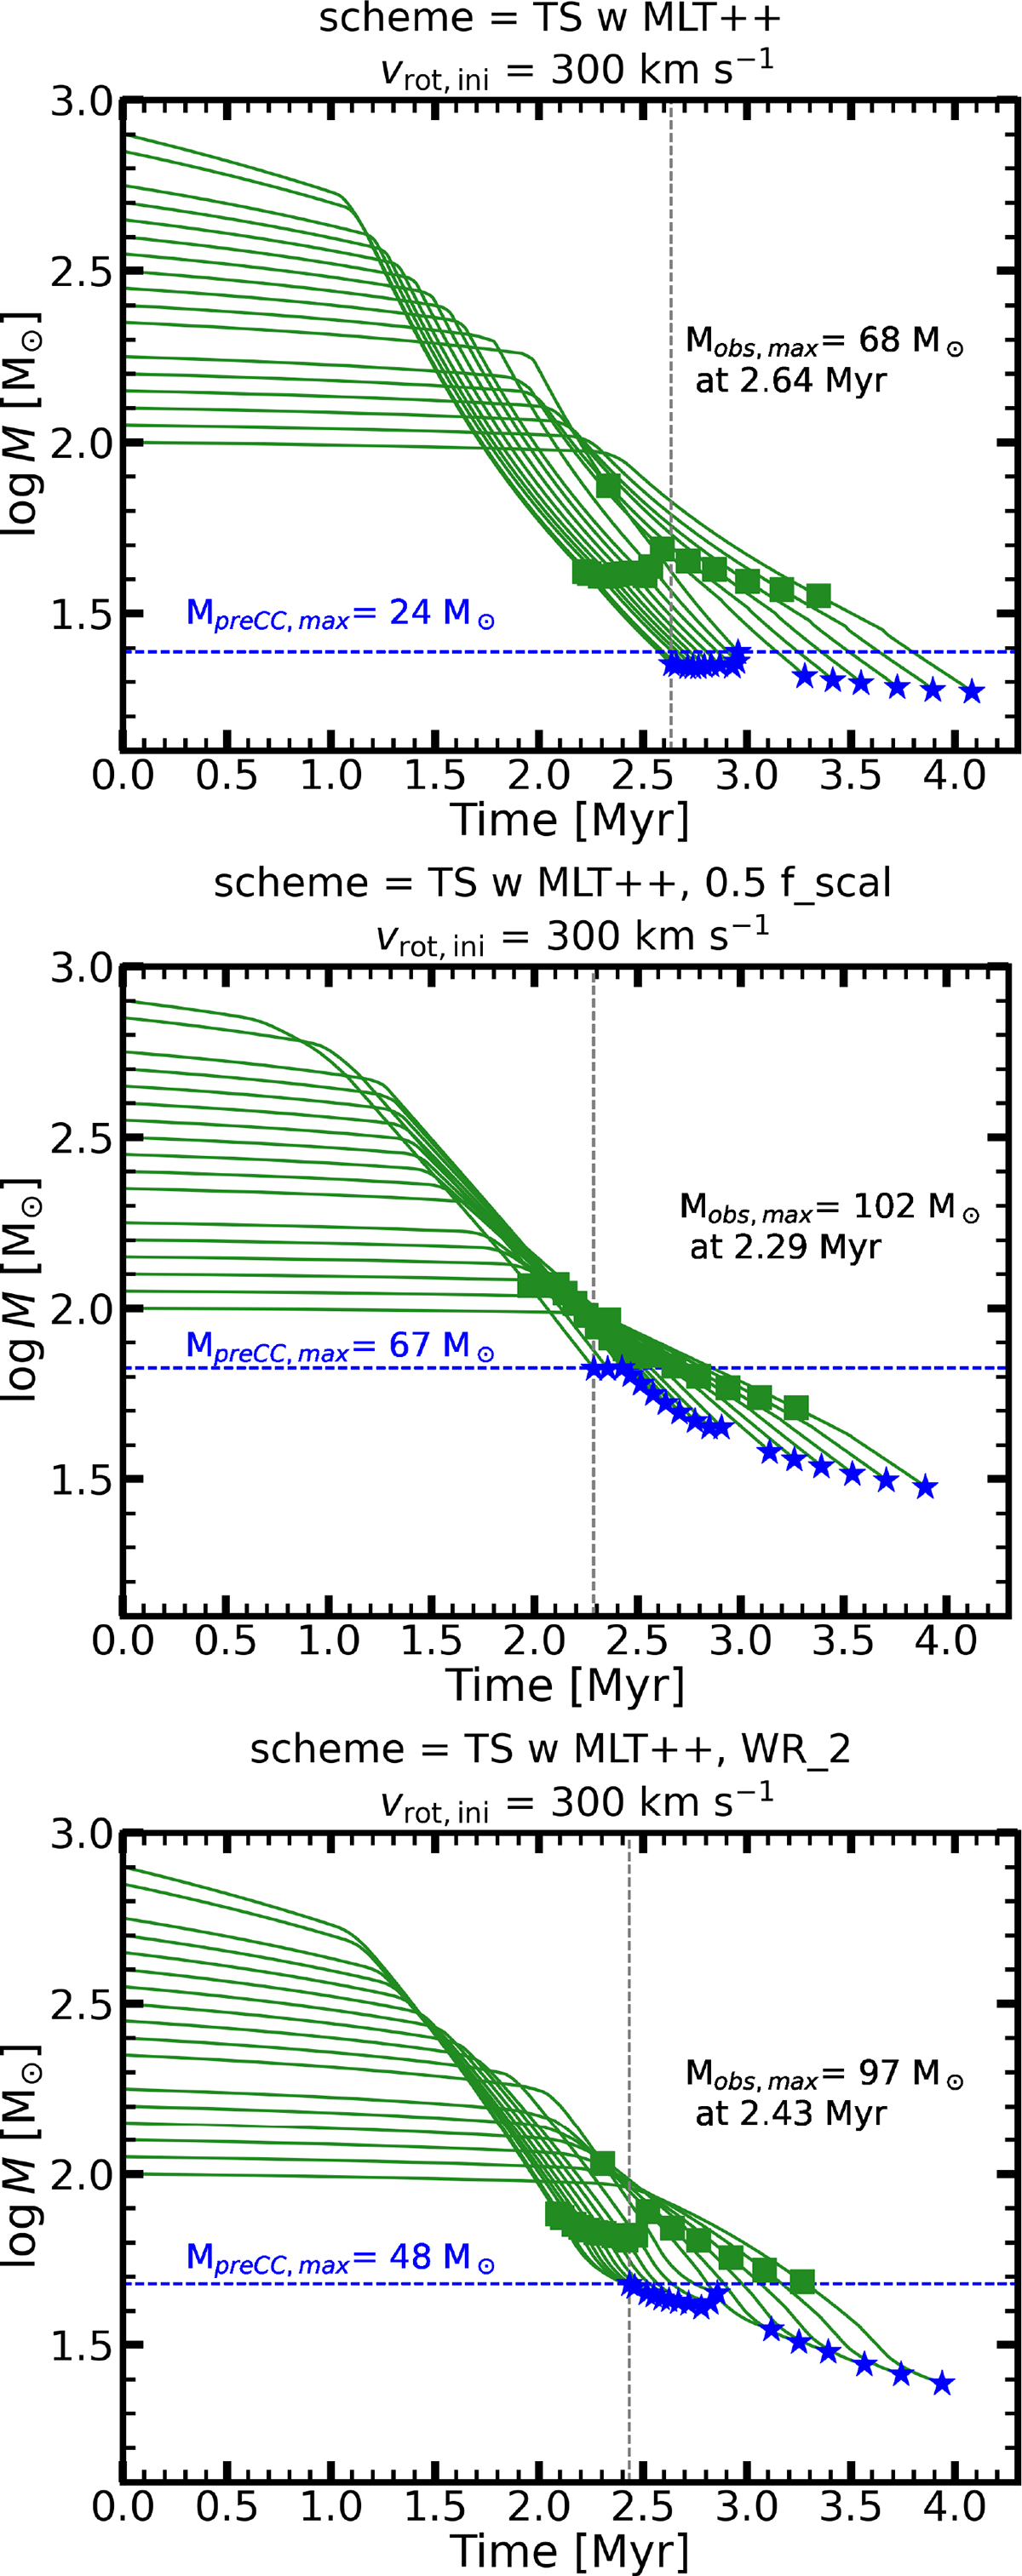
Download original image
Evolution of stellar mass as a function of time. Models within the Tayler-Spruit coupling scheme with MLT++ are shown for an initial rotational velocity of 300 km s−1. The grey vertical line indicates the time when the first SN takes place. Mobs, max indicates the maximum stellar mass observable at that time. MpreCC, max is the highest pre-core collapse mass by the end of the evolution of all models. Green squares mark the TAMS and blue stars denote successfully reaching the C-TAMS phase. Top panel: our fiducial models. Middle panel: Reduced mass-loss rates over the entire evolution by a factor of 2. Note: this allows for the producion of SN progenitors with more than double the mass. Lower panel: Switching to the Nugis & Lamers (2002) rates instead of the Sander & Vink (2020) rates.
Current usage metrics show cumulative count of Article Views (full-text article views including HTML views, PDF and ePub downloads, according to the available data) and Abstracts Views on Vision4Press platform.
Data correspond to usage on the plateform after 2015. The current usage metrics is available 48-96 hours after online publication and is updated daily on week days.
Initial download of the metrics may take a while.