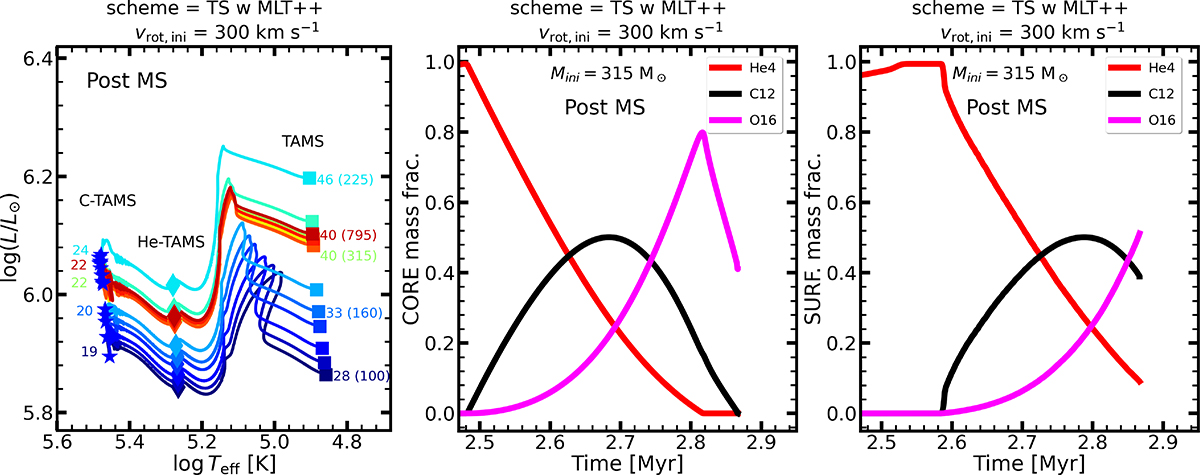
Fig. 4.
Download original image
Post-main sequence evolutionary tracks in the Taylor-Spruit scheme with vini = 300 km s−1. Left panel: HRD from the (TAMS with squares), through the helium-TAMS (diamonds), until carbon-TAMS (blue stars). The colours denote different initial masses. On the right-hand side of this panel, the TAMS masses are shown in solar units and the ZAMS masses are indicated in brackets. Corresponding to these cases, the masses at the C-TAMS are also shown in solar units on the left-hand side. Middle and right panels: post-main sequence evolution of core and surface helium, carbon, and oxygen mass fractions for the initially 315 M⊙ model.
Current usage metrics show cumulative count of Article Views (full-text article views including HTML views, PDF and ePub downloads, according to the available data) and Abstracts Views on Vision4Press platform.
Data correspond to usage on the plateform after 2015. The current usage metrics is available 48-96 hours after online publication and is updated daily on week days.
Initial download of the metrics may take a while.