Fig. 5.
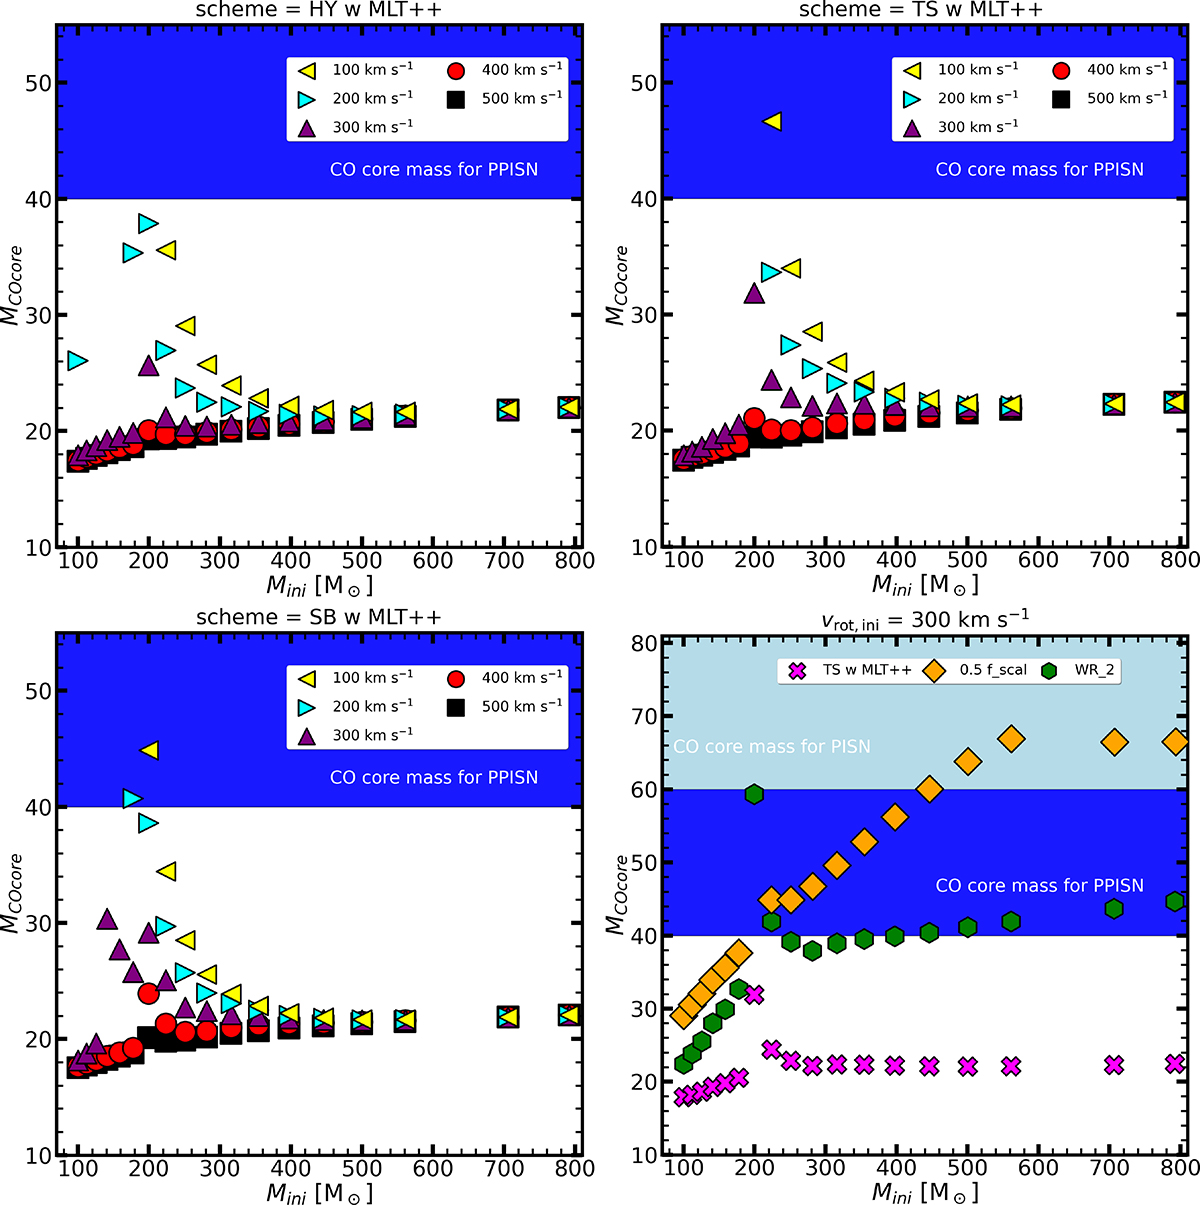
Download original image
Maximum carbon-oxygen core mass as a function of initial stellar mass. The HY, TS, and SB coupling schemes are shown on the top left, top right, and lower left, respectively. These panels include all initial rotational velocities calculated in our grid (shown with different symbols and colours). The lower right panel shows models with a 300 km s−1 initial rotational velocity in the TS coupling scheme, varying only the mass-loss schemes (magenta cross: nominal scheme; orange diamond: reduction of overall mass-loss rates by a factor of 2; green hexagon: switching to different Wolf-Rayet type rates). The shaded regions denote the approximate limits for pulsational pair instability (blue) and pair instability (light blue) SNe. We note the different vertical axis scale in the lower right panel.
Current usage metrics show cumulative count of Article Views (full-text article views including HTML views, PDF and ePub downloads, according to the available data) and Abstracts Views on Vision4Press platform.
Data correspond to usage on the plateform after 2015. The current usage metrics is available 48-96 hours after online publication and is updated daily on week days.
Initial download of the metrics may take a while.