Fig. 7.
Download original image
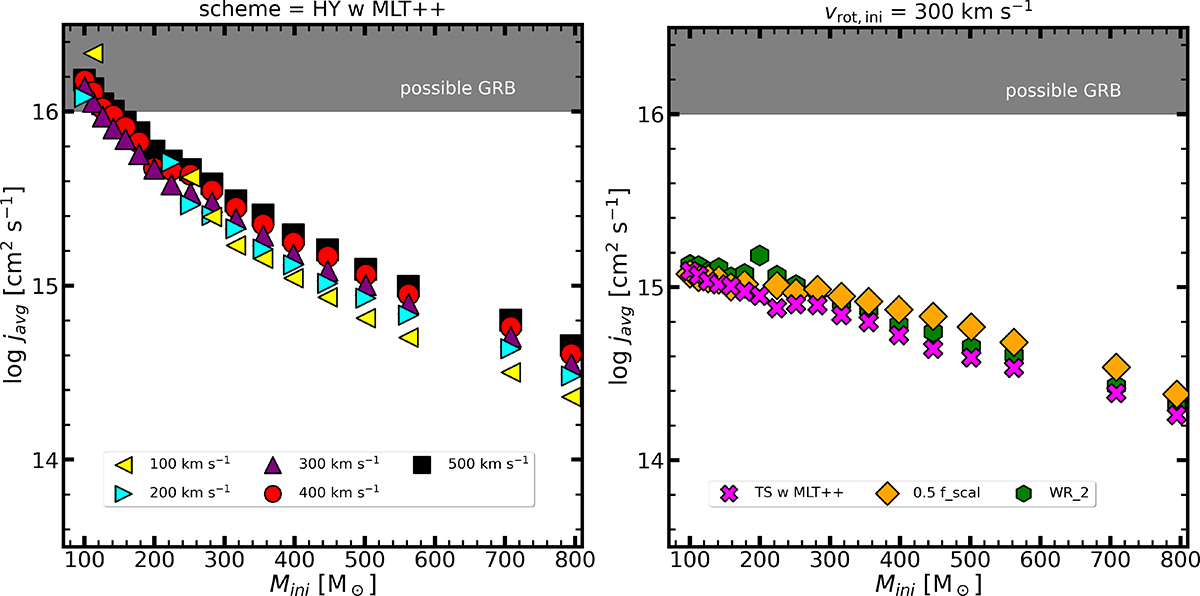
Average specific angular momentum within the central 5 solar masses of the core at the end of carbon core burning versus the initial mass. Left: Hydrodynamical coupling scheme. Right: Our experiment with different mass-loss rates. The symbols denote different initial rotational velocities (left) or different mass-loss schemes (right). The approximate limit to produce GRBs is shown with the gray region.
Current usage metrics show cumulative count of Article Views (full-text article views including HTML views, PDF and ePub downloads, according to the available data) and Abstracts Views on Vision4Press platform.
Data correspond to usage on the plateform after 2015. The current usage metrics is available 48-96 hours after online publication and is updated daily on week days.
Initial download of the metrics may take a while.