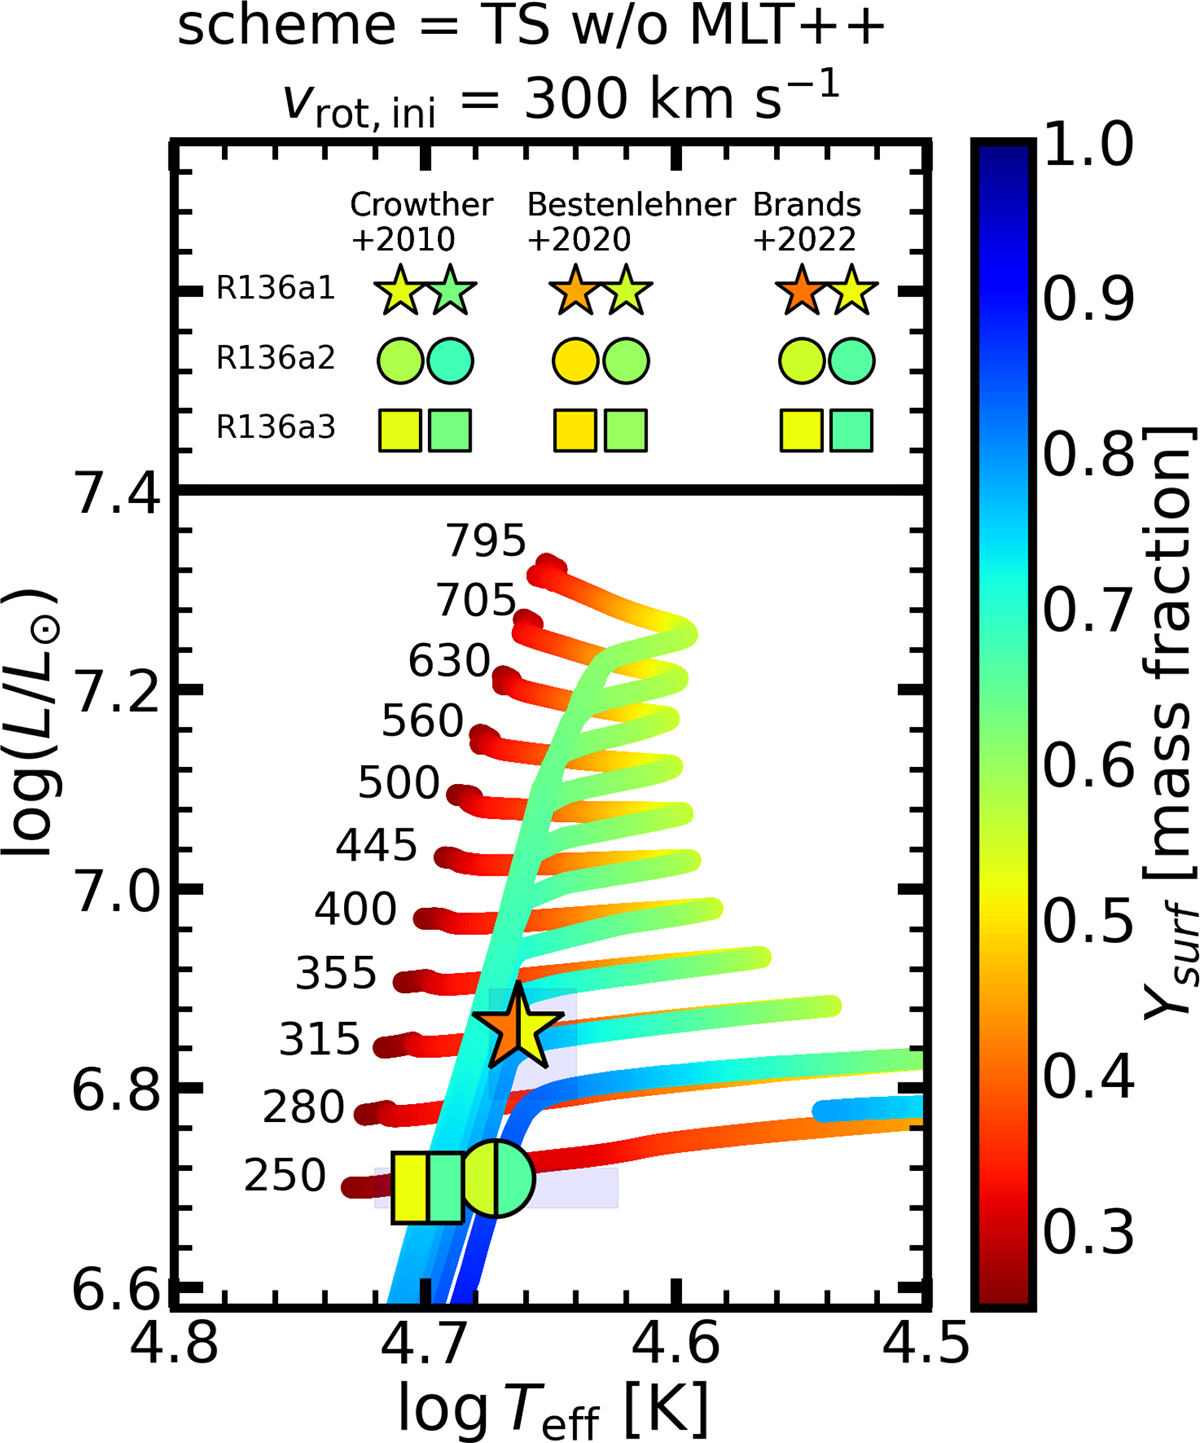
Fig. 8.
Download original image
HRD colour-coded with the surface helium mass fraction in our models (using the Taylor-Spruit scheme without MLT++ with an initial rotational velocity of 300 km s−1) and in observations of the WNh stars R136a1 (star), R136a2 (circle), and R136a3 (square). The initial mass of the evolutionary tracks is indicated in solar units. We apply smoothing to avoid numerical noise. Uncertainty ranges (lower and upper limits) in the measured helium abundances from three authors are indicated in the upper part (see also Table 2). For the nominal values, we adopt the Brands et al. (2022) results and show the lower and upper limits as the left and right side of the filled markers. The shaded regions show the formal uncertainty in logL and Teff from Brands et al. (2022).
Current usage metrics show cumulative count of Article Views (full-text article views including HTML views, PDF and ePub downloads, according to the available data) and Abstracts Views on Vision4Press platform.
Data correspond to usage on the plateform after 2015. The current usage metrics is available 48-96 hours after online publication and is updated daily on week days.
Initial download of the metrics may take a while.