Open Access
Fig. 1
Download original image
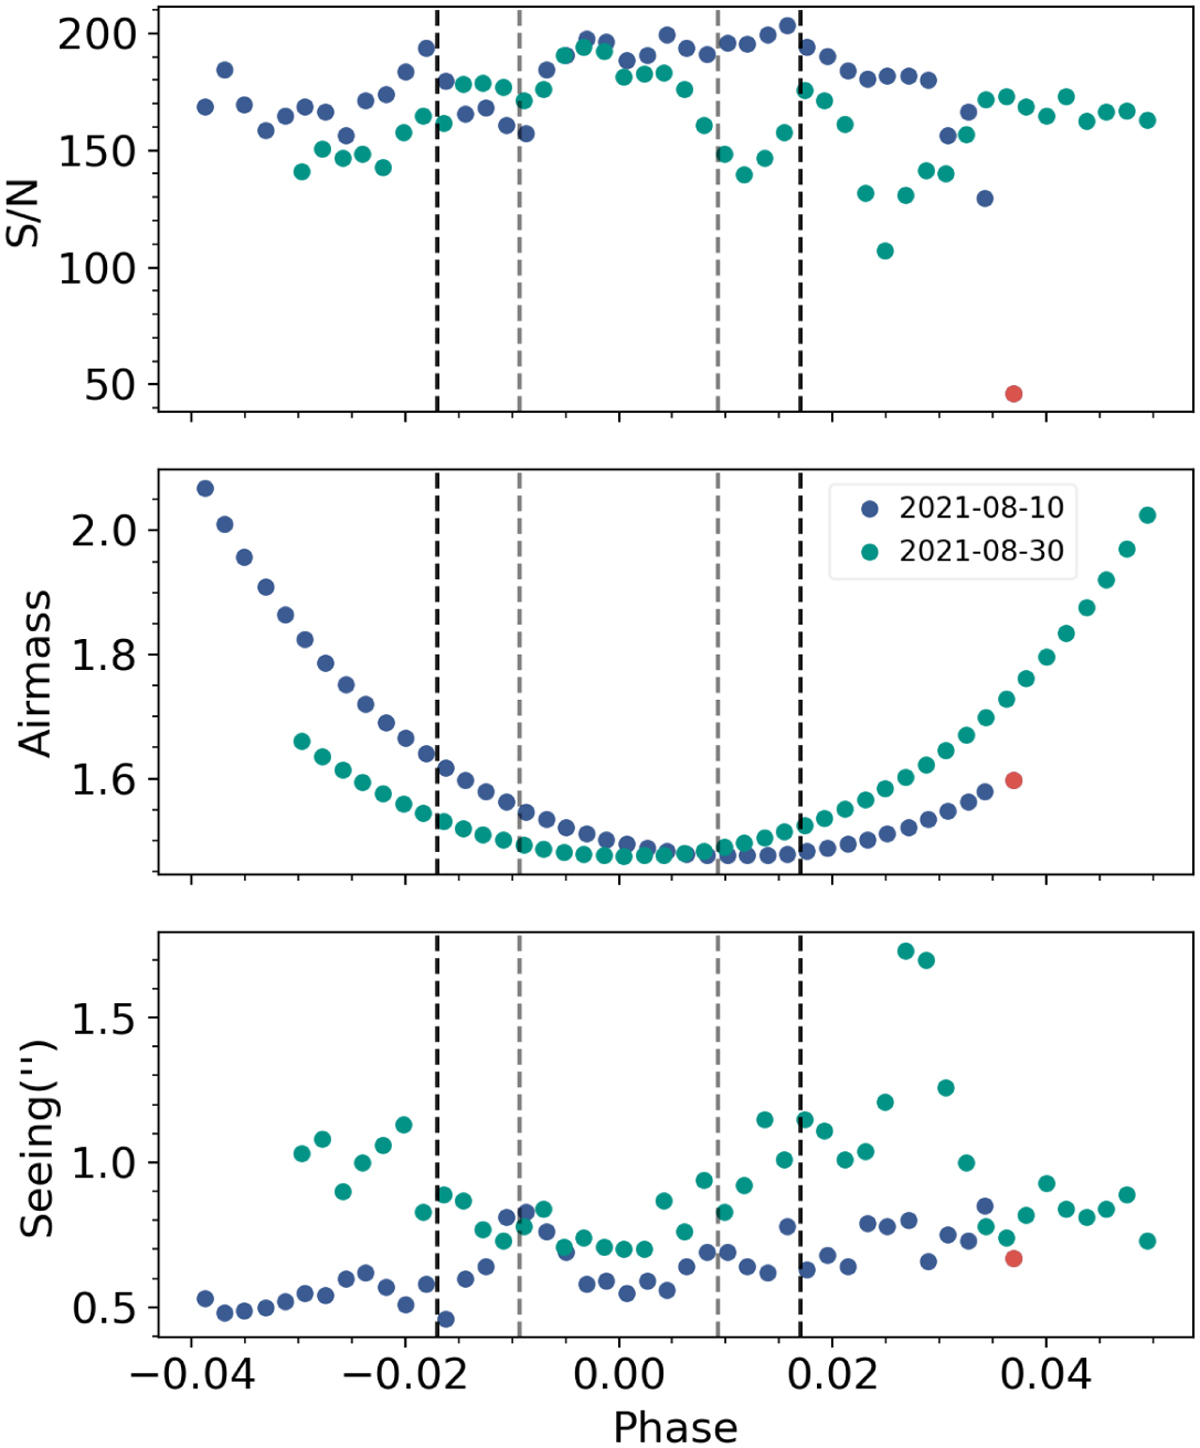
Signal-to-noise ratio, airmass, and seeing taken during the two observation nights as a function of the transit phase. Zero is the center of the transit, and the dashed black vertical lines show the transit contact points from T1 to T4. The last spectrum of the first night was discarded because the S/N is far lower.
Current usage metrics show cumulative count of Article Views (full-text article views including HTML views, PDF and ePub downloads, according to the available data) and Abstracts Views on Vision4Press platform.
Data correspond to usage on the plateform after 2015. The current usage metrics is available 48-96 hours after online publication and is updated daily on week days.
Initial download of the metrics may take a while.