Fig. 12
Download original image
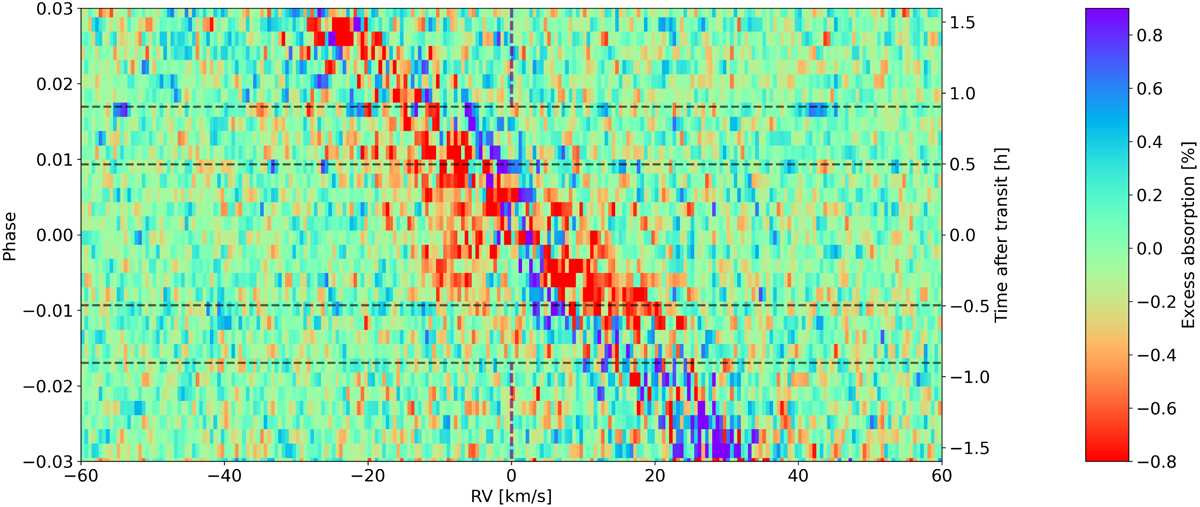
Transmission spectra map of HD 189733 b around the sodium doublet (co-added and both transits combined) after POLDs correction using synthetic models on individual spectra in the planetary rest frame (see Fig. D.1 for the uncorrected version). The dashed dark purple line indicates the sodium planetary rest velocity, and the horizontal dashed lines show the transit contacts T1, T2, T3, and T4 from bottom to top.
Current usage metrics show cumulative count of Article Views (full-text article views including HTML views, PDF and ePub downloads, according to the available data) and Abstracts Views on Vision4Press platform.
Data correspond to usage on the plateform after 2015. The current usage metrics is available 48-96 hours after online publication and is updated daily on week days.
Initial download of the metrics may take a while.