Fig. 15
Download original image
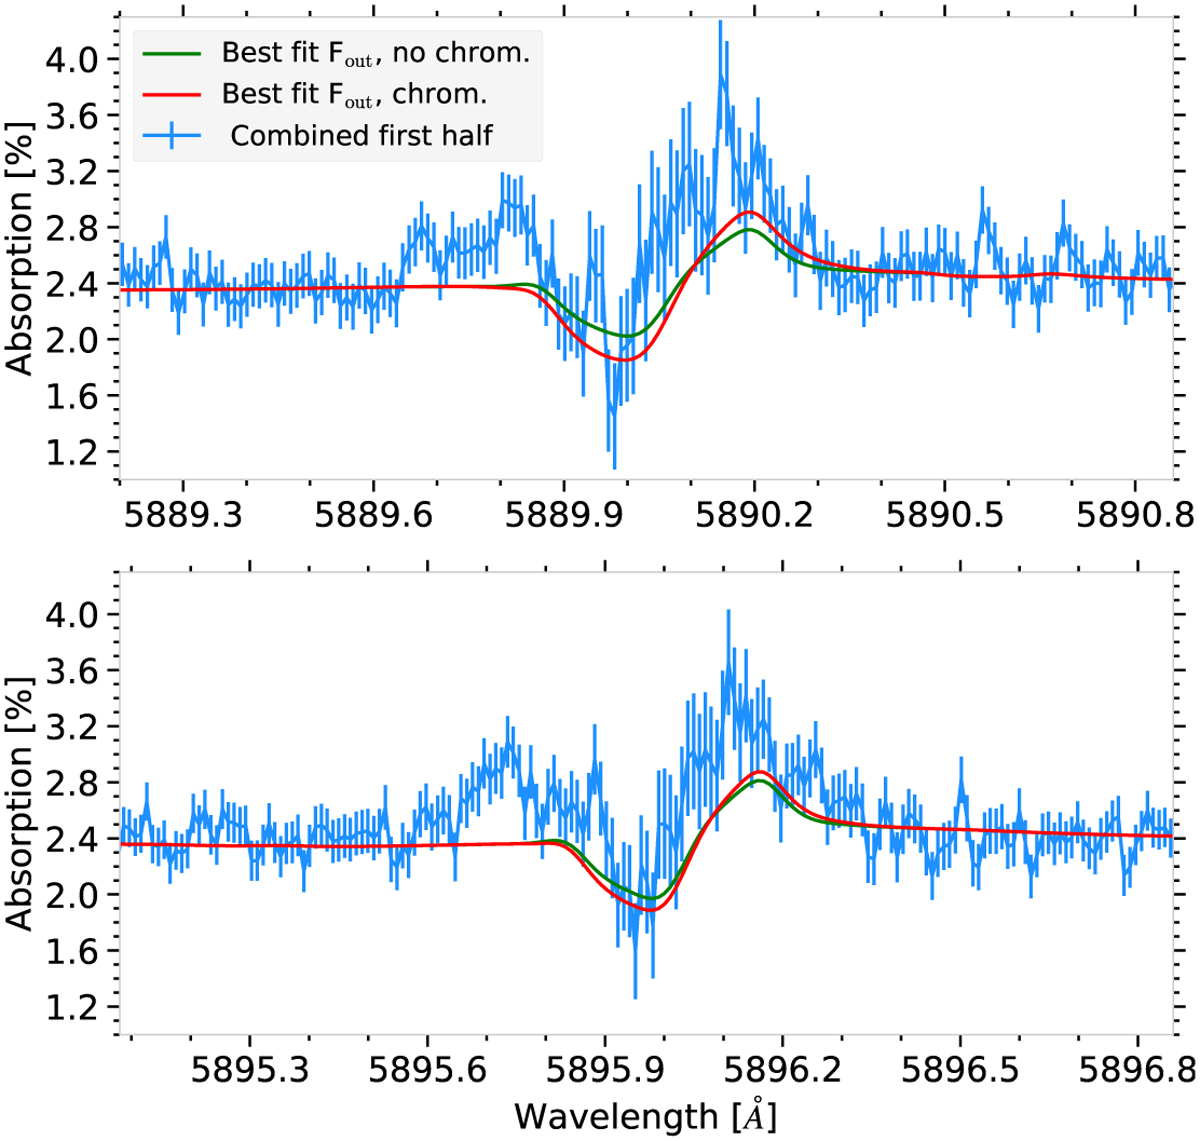
Mean absorption spectra between T2 and T0 of night 1. The green curve was computed using the stellar grid that best matched the observed Fout without the additional chromospheric absorption. The red curve was computed using the stellar grid that best matched the observed Fout with the additional chromospheric absorption. The top panel focuses on the Na I D2 line and the bottom one on the NaI D1 line.
Current usage metrics show cumulative count of Article Views (full-text article views including HTML views, PDF and ePub downloads, according to the available data) and Abstracts Views on Vision4Press platform.
Data correspond to usage on the plateform after 2015. The current usage metrics is available 48-96 hours after online publication and is updated daily on week days.
Initial download of the metrics may take a while.