Fig. 17
Download original image
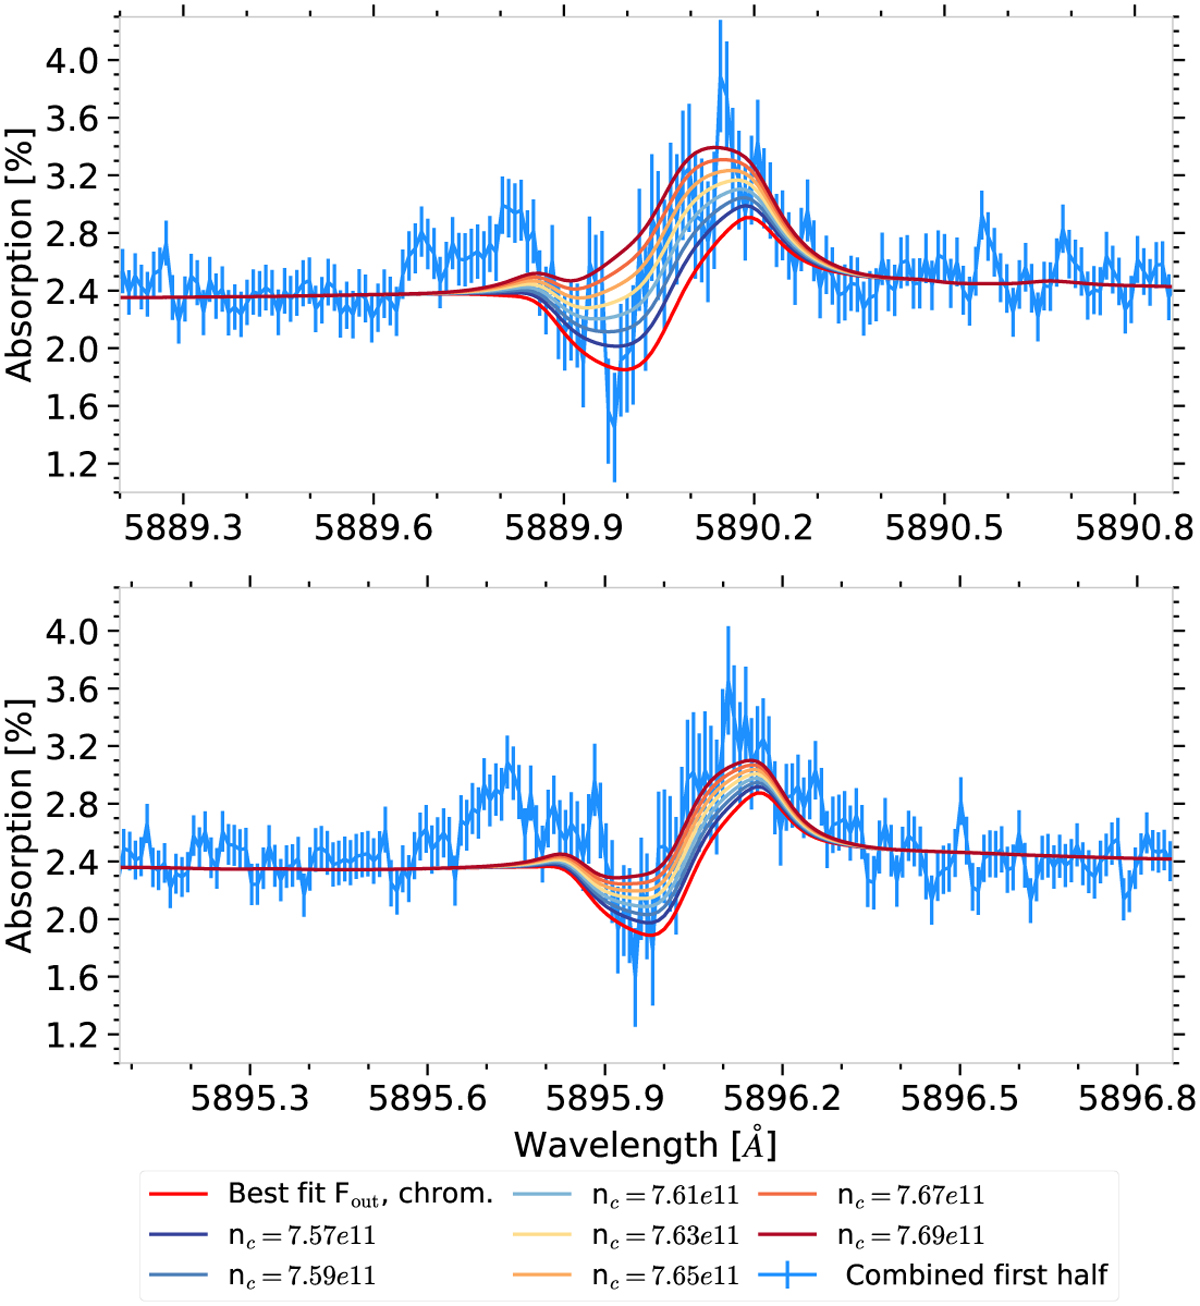
Mean absorption spectra between T2 and T0 of night 1. The red curve was computed using the stellar grid that best matched the observed Fout using the additional chromospheric absorption. The other curves are computed using the Fout from the best fit and Fin’s from modified stellar spectral grids. As a reference for the best fit, nc = 7.54 × 10¹¹ atoms cm−3. These specific values should only be regarded to get a sense of how the sodium lines were modified, and not as exact values for this specific system.
Current usage metrics show cumulative count of Article Views (full-text article views including HTML views, PDF and ePub downloads, according to the available data) and Abstracts Views on Vision4Press platform.
Data correspond to usage on the plateform after 2015. The current usage metrics is available 48-96 hours after online publication and is updated daily on week days.
Initial download of the metrics may take a while.