Fig. A.1
Download original image
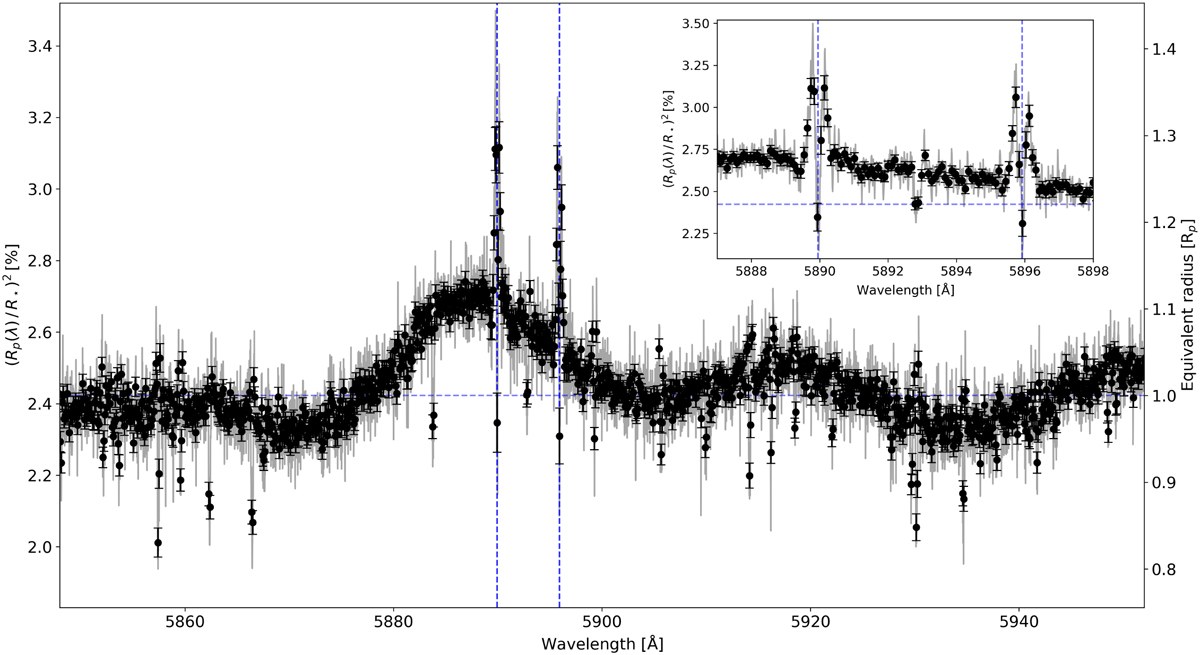
Binned transmission spectrum of HD 189733 b without wiggles correction (see Sect. 2.3.2) combining both transits around the sodium doublet (vertical blue dashed lines). The unbinned transmission spectrum is shown in gray, the black dots representing the binned spectrum with step of 0.1 A. The horizontal blue line is the white-light radius (Rp/R*)2. The zoomed-in panel shows a close-up view on the sodium doublet with similar wavelength interval to Fig. 7. The wiggles occur at a lower frequency than the POLDs and absorption signal. The correction of that pattern does not influence the shape of the signature around the sodium lines.
Current usage metrics show cumulative count of Article Views (full-text article views including HTML views, PDF and ePub downloads, according to the available data) and Abstracts Views on Vision4Press platform.
Data correspond to usage on the plateform after 2015. The current usage metrics is available 48-96 hours after online publication and is updated daily on week days.
Initial download of the metrics may take a while.