Fig. 2
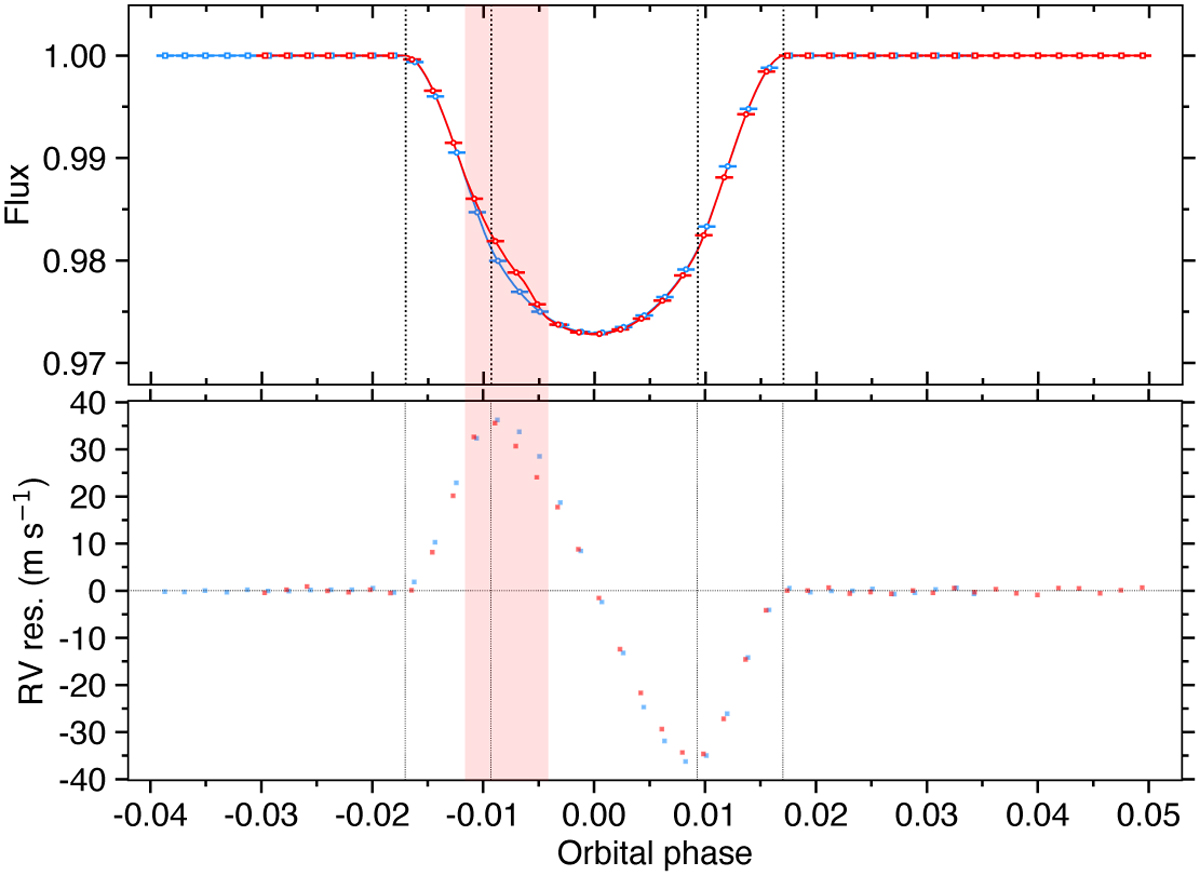
Download original image
Transit comparison between Visit 1 (blue) and Visit 2 (red). ESPRESSO exposures are indicated by the colored symbols. Vertical dashed lines indicate transit contacts. Top panel: best-fit model light curves to the EulerCam photometry obtained simultaneously with the ESPRESSO transits, used to scale disk-integrated CCFs to their correct relative flux level. Bottom panel: RV centroids of the disk-integrated CCFs, computed from spectra Doppler-corrected for the stellar Keplerian motion and linear drifts with phase. The spot occultation visible in Visit 2 photometry, occurring within the red-shaded window, induces a clear deviation to the nominal RM anomaly in RV, which has also been found in Cristo et al. (2024).
Current usage metrics show cumulative count of Article Views (full-text article views including HTML views, PDF and ePub downloads, according to the available data) and Abstracts Views on Vision4Press platform.
Data correspond to usage on the plateform after 2015. The current usage metrics is available 48-96 hours after online publication and is updated daily on week days.
Initial download of the metrics may take a while.