Fig. 6
Download original image
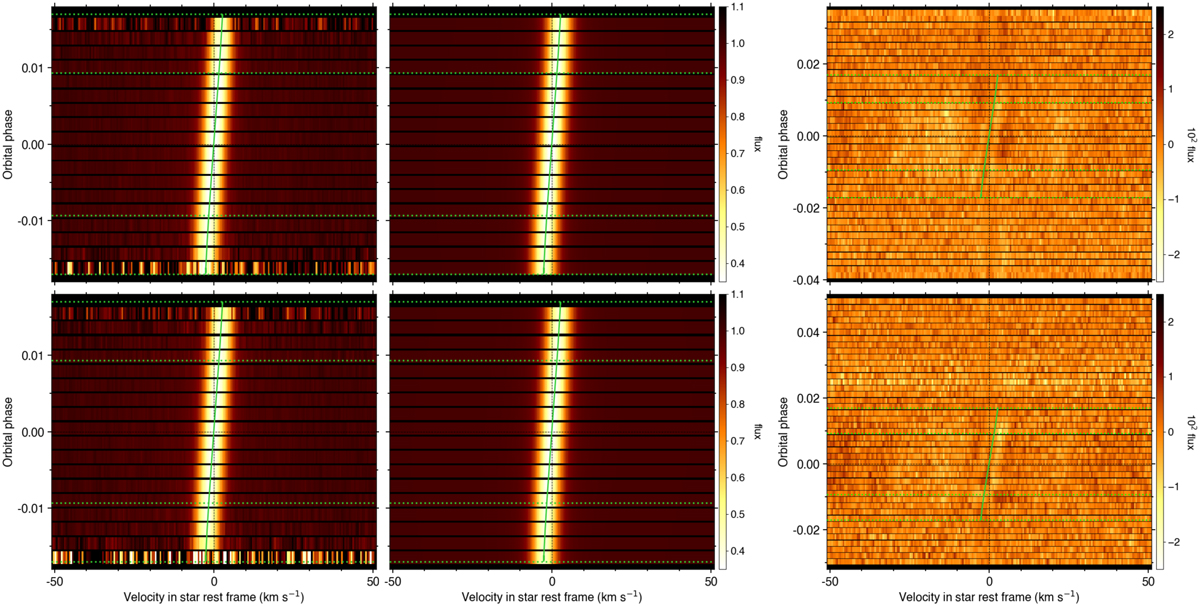
RMR maps in Visit 1 (top panel) and Visit 2 (bottom panel), plotted as a function of RV in the star rest frame (abscissa) and orbital phase (ordinate). The horizontal dashed green lines show the transit contacts. The solid green line indicates the surface RVs track associated with the best RMR fit. Left panels: measured intrinsic CCFs. Middle panels: best-fit RMR model to the joined intrinsic CCF series. Right panels: residuals between the out-of-transit CCFs and the master-out CCF (outside of the transit window) and between the intrinsic CCFs and their best-fit model (scaled to the level of the out-of-transit residuals).
Current usage metrics show cumulative count of Article Views (full-text article views including HTML views, PDF and ePub downloads, according to the available data) and Abstracts Views on Vision4Press platform.
Data correspond to usage on the plateform after 2015. The current usage metrics is available 48-96 hours after online publication and is updated daily on week days.
Initial download of the metrics may take a while.