Fig. 9
Download original image
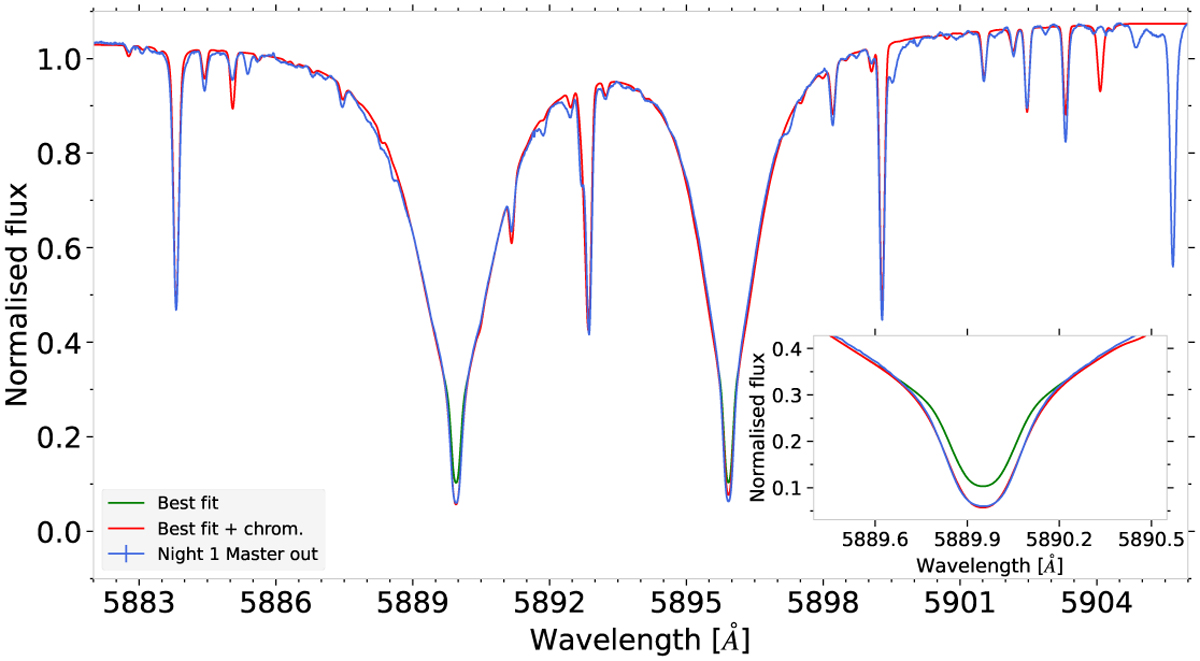
Disk-integrated spectra of HD 189733 in the sodium region. The blue curve shows the observed master out-of-transit spectrum for the first night, the green curve shows the best fit synthetic Turbospectrum model, and the red curve shows the best fit with the additional absorption of sodium. The subplot on the bottom left shows a zoom on the D2 line and its labels are the same as those of the main plot.
Current usage metrics show cumulative count of Article Views (full-text article views including HTML views, PDF and ePub downloads, according to the available data) and Abstracts Views on Vision4Press platform.
Data correspond to usage on the plateform after 2015. The current usage metrics is available 48-96 hours after online publication and is updated daily on week days.
Initial download of the metrics may take a while.