Open Access
Fig. 5
Download original image
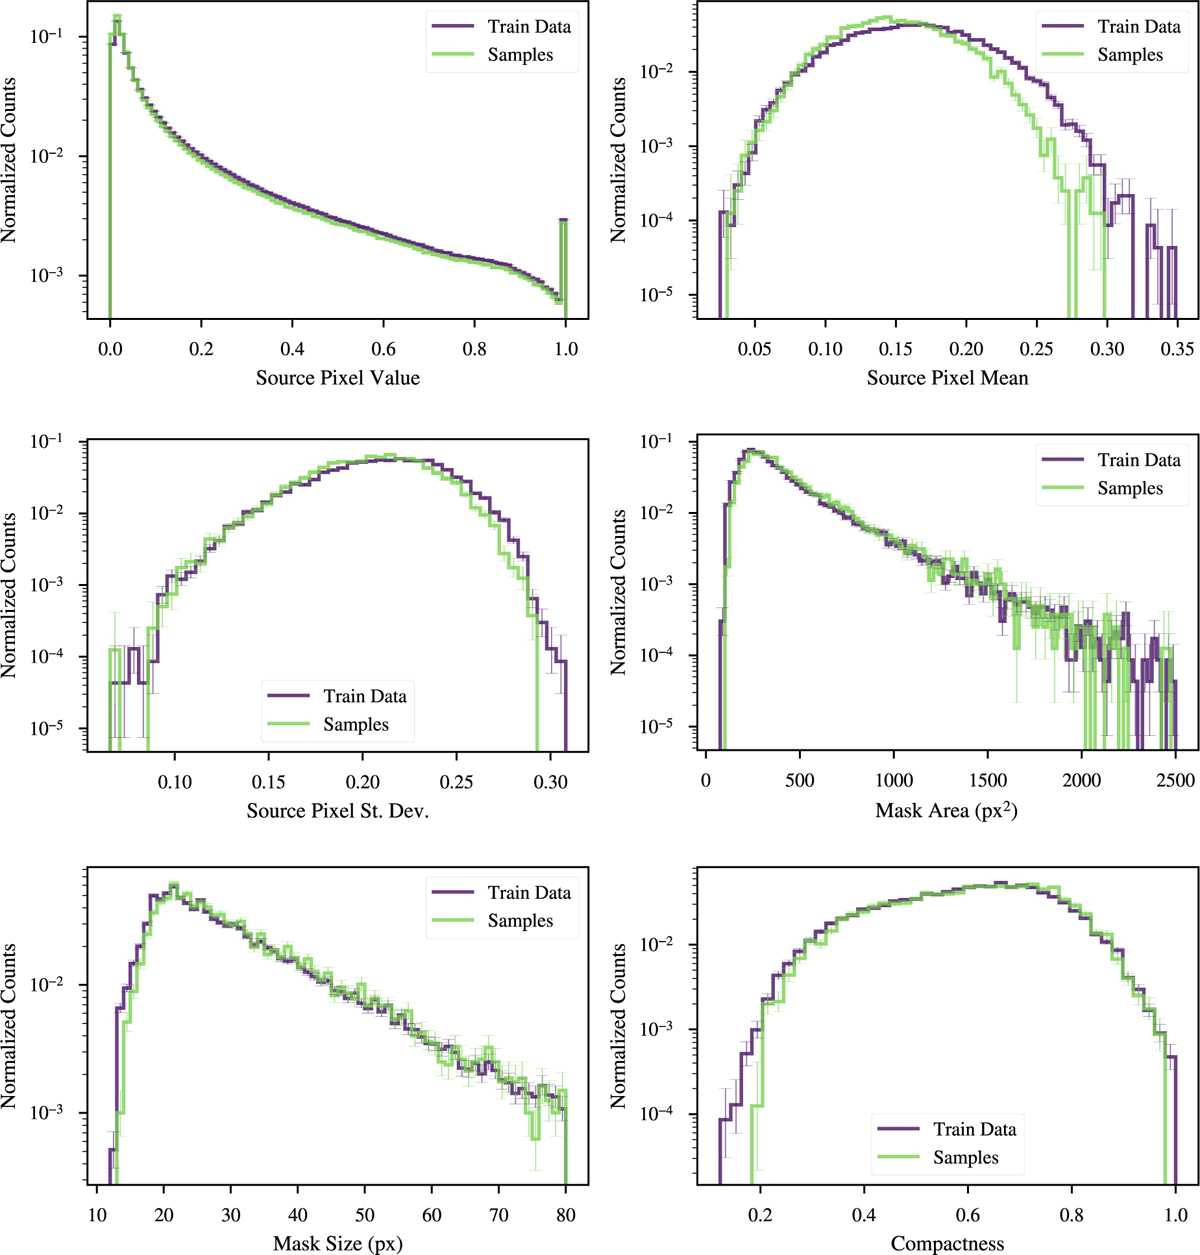
Histograms of the metrics introduced in 4.1 showing the distribution over the training dataset and DM-generated images. In the case of pixel values, mean and standard deviation, only pixels that fall within the source mask are included.
Current usage metrics show cumulative count of Article Views (full-text article views including HTML views, PDF and ePub downloads, according to the available data) and Abstracts Views on Vision4Press platform.
Data correspond to usage on the plateform after 2015. The current usage metrics is available 48-96 hours after online publication and is updated daily on week days.
Initial download of the metrics may take a while.