Open Access
Fig. 8
Download original image
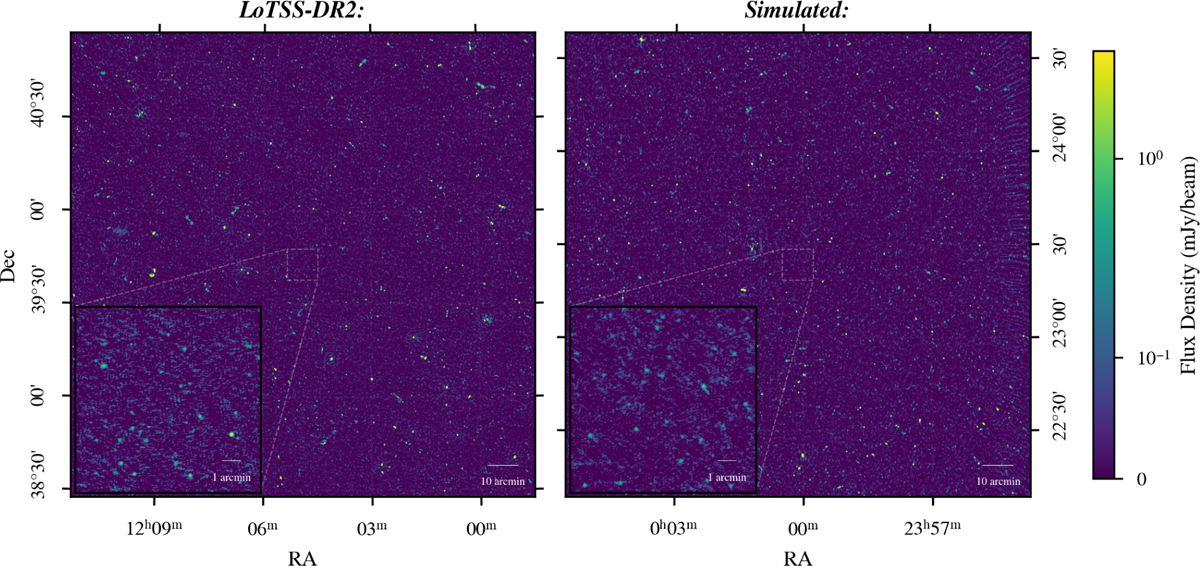
Side-by-side display of a real LoTSS map (left) and our simulated map (right). The LoTSS image is from the P181+40 mosaic (Shimwell et al. 2022b). In both cases, the image is a 2.5° center cutout and the inlet shows a 10′ center cutout.
Current usage metrics show cumulative count of Article Views (full-text article views including HTML views, PDF and ePub downloads, according to the available data) and Abstracts Views on Vision4Press platform.
Data correspond to usage on the plateform after 2015. The current usage metrics is available 48-96 hours after online publication and is updated daily on week days.
Initial download of the metrics may take a while.