Open Access
Fig. 9
Download original image
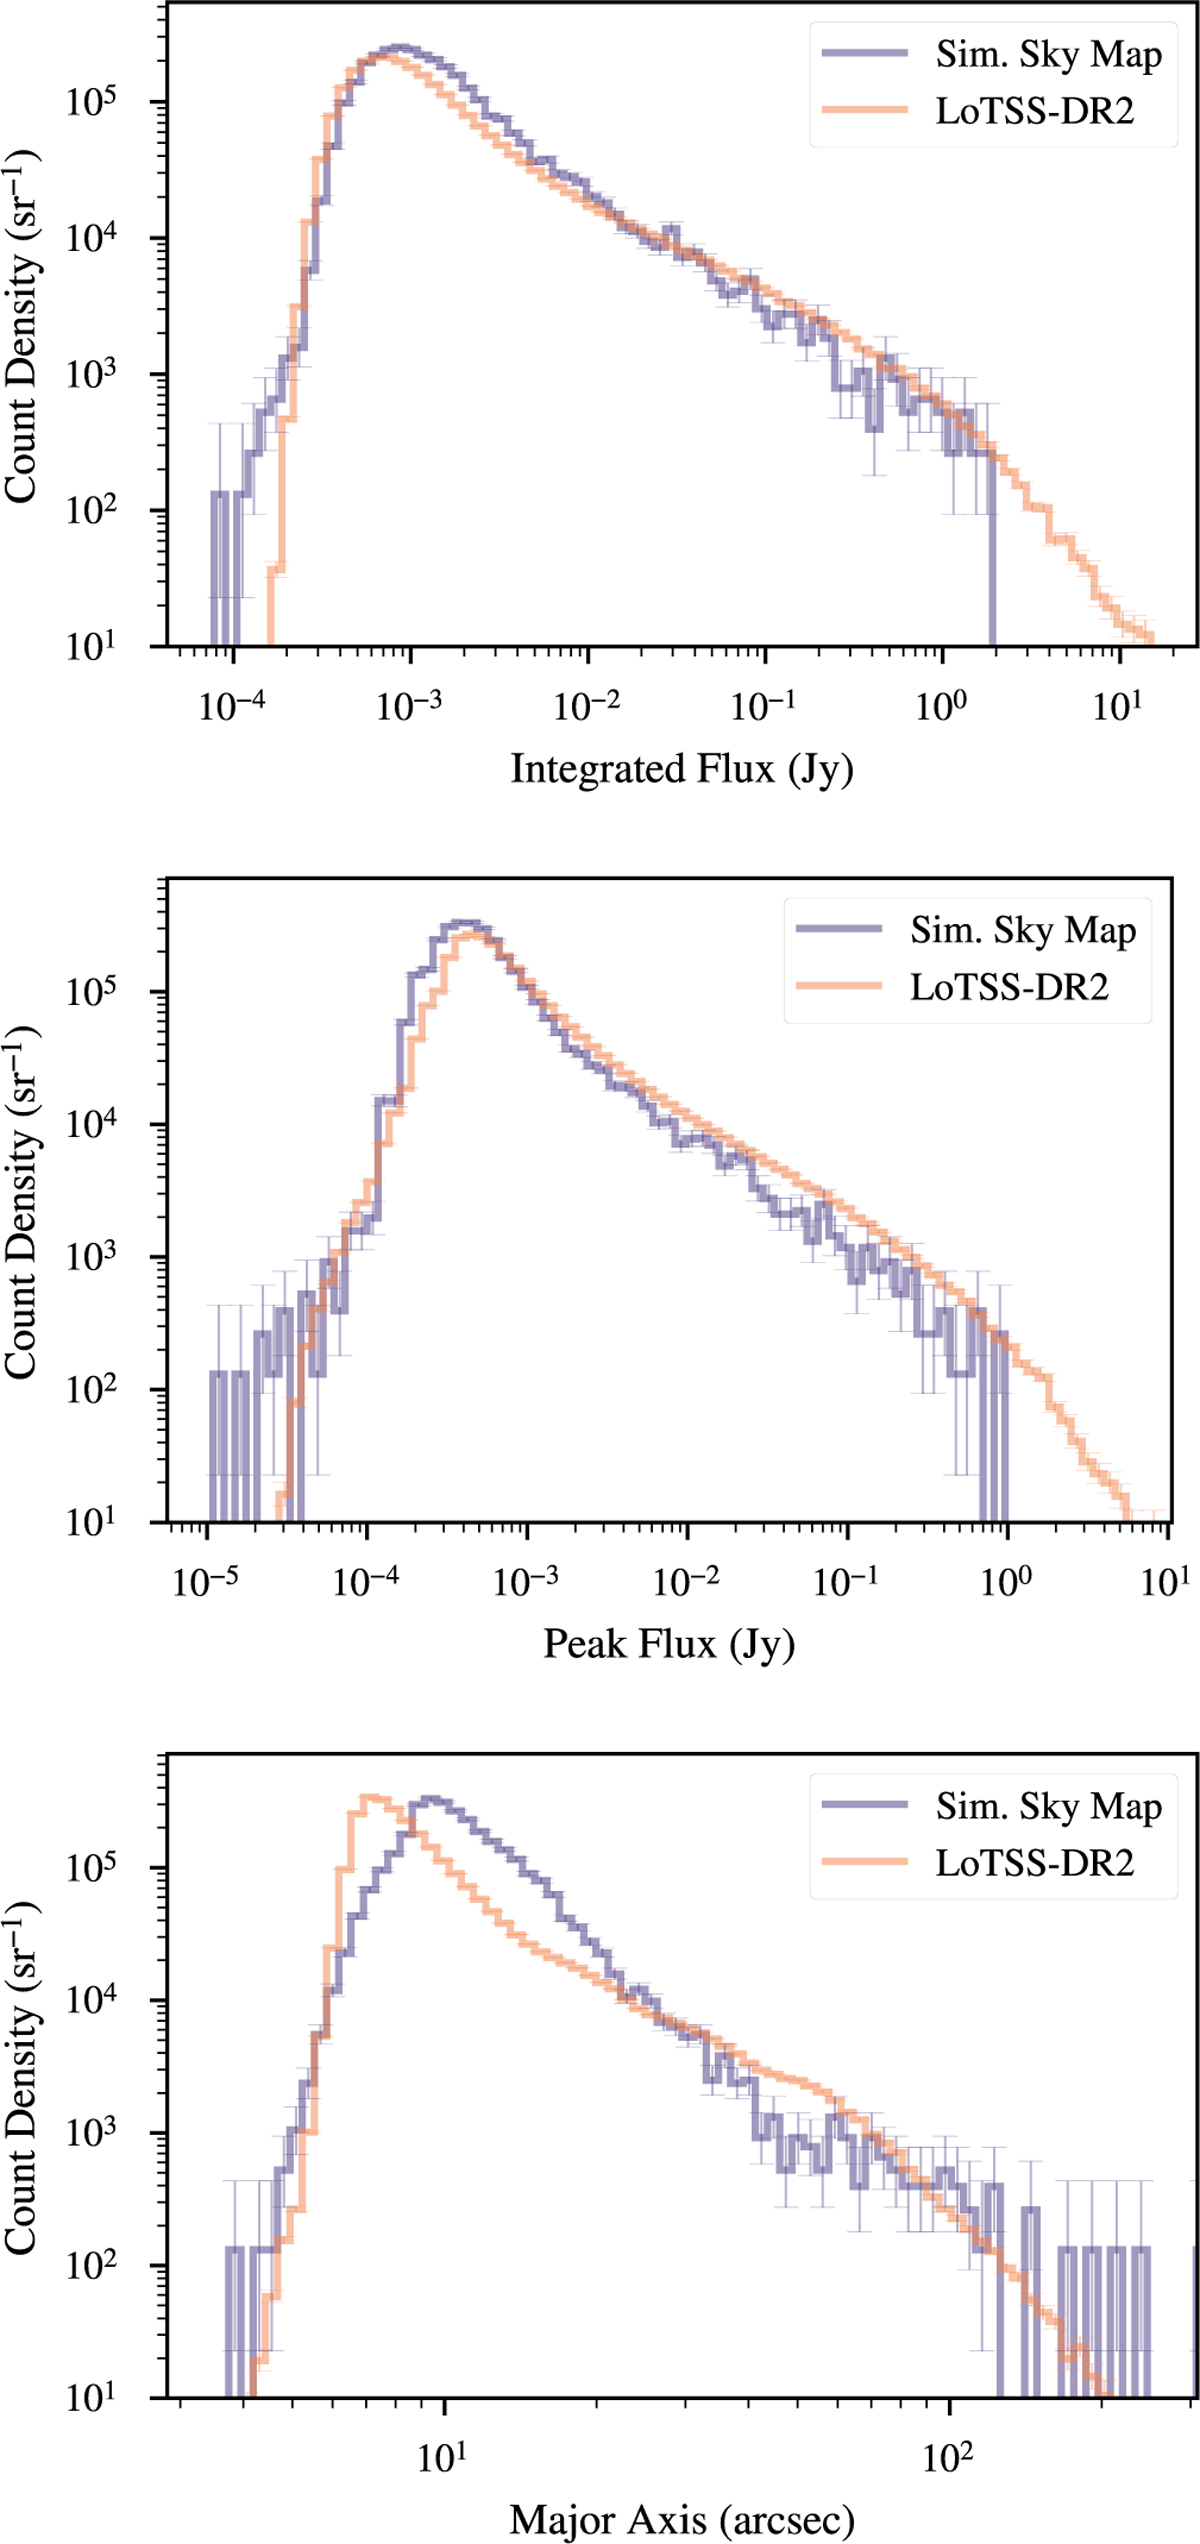
Histograms of the integrated flux, peak flux, and major axis values, showing the distributions over sources in the catalogs of the simulated sky map the LoTSS-DR2 maps.
Current usage metrics show cumulative count of Article Views (full-text article views including HTML views, PDF and ePub downloads, according to the available data) and Abstracts Views on Vision4Press platform.
Data correspond to usage on the plateform after 2015. The current usage metrics is available 48-96 hours after online publication and is updated daily on week days.
Initial download of the metrics may take a while.