Open Access
Fig. 5
Download original image
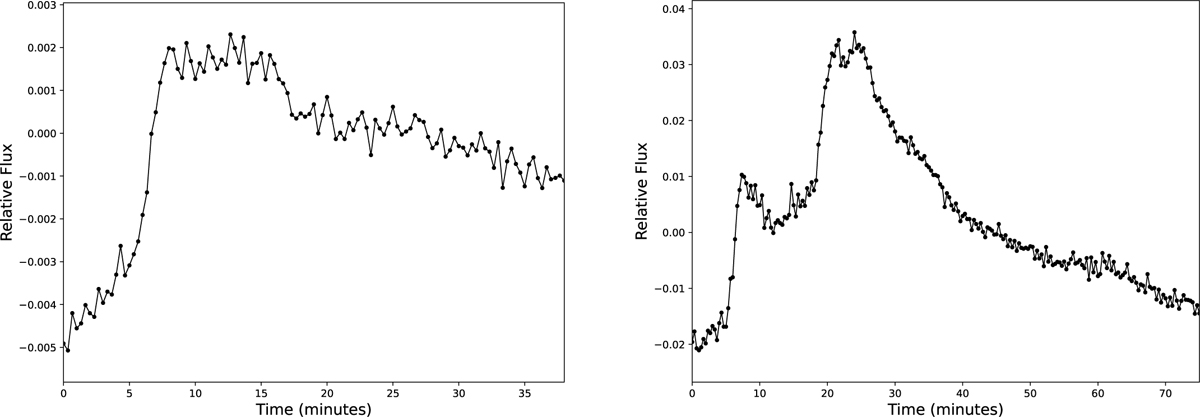
Example of a flare with a flat-top morphology (left) and a complex multi-peak structure (right). Such flares are harder to detect in lower cadence observations such as the 2-minute TES S observations.
Current usage metrics show cumulative count of Article Views (full-text article views including HTML views, PDF and ePub downloads, according to the available data) and Abstracts Views on Vision4Press platform.
Data correspond to usage on the plateform after 2015. The current usage metrics is available 48-96 hours after online publication and is updated daily on week days.
Initial download of the metrics may take a while.