Fig. 6
Download original image
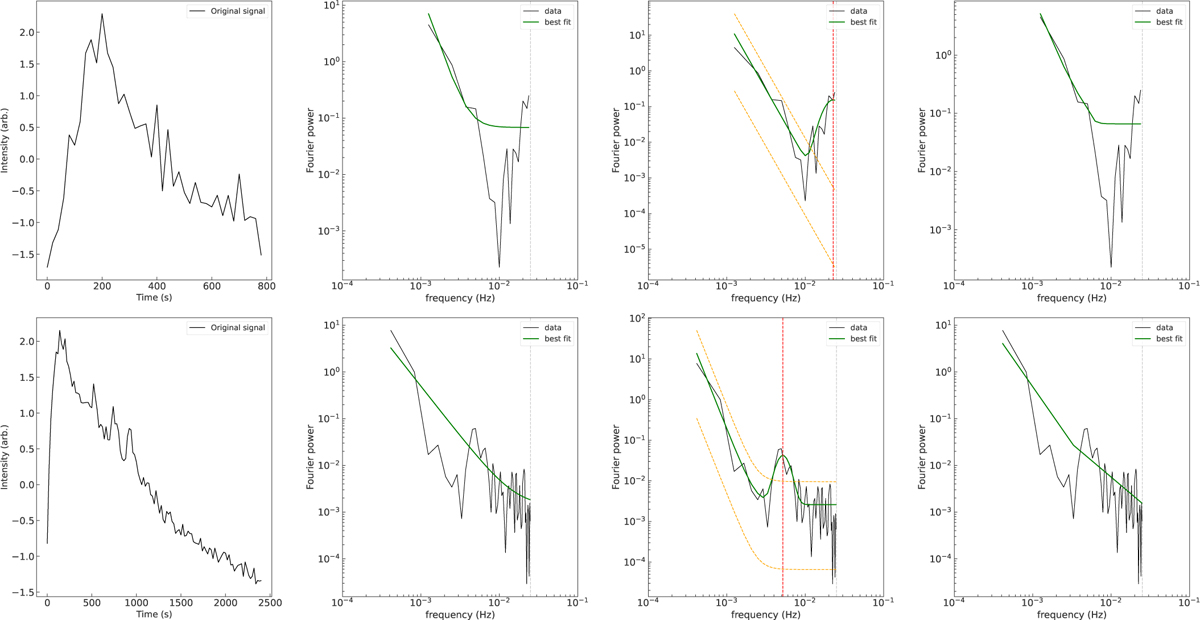
Example of AFINO models applied to a stellar flare detected in TIC 33878971 (top panel) and TIC 303443210 (bottom panel). From left to right: (1) Flare light curve showing the observed flare variations, highlighting the detected QPP peaks. (2) Single power-law model fit to the power spectrum (solid line), highlighting no QPP detection. (3) Power-law model with a Gaussian bump (solid line), demonstrating excess power at a specific frequency indicative of quasi-periodic pulsations. The vertical dashed red line denotes the fp, the location of the bump in the PSD. The dashed orange line indicates the ± 2σ confidence interval around the fitted power-law component. (4) Broken power-law model fit.
Current usage metrics show cumulative count of Article Views (full-text article views including HTML views, PDF and ePub downloads, according to the available data) and Abstracts Views on Vision4Press platform.
Data correspond to usage on the plateform after 2015. The current usage metrics is available 48-96 hours after online publication and is updated daily on week days.
Initial download of the metrics may take a while.