Fig. A.1
Download original image
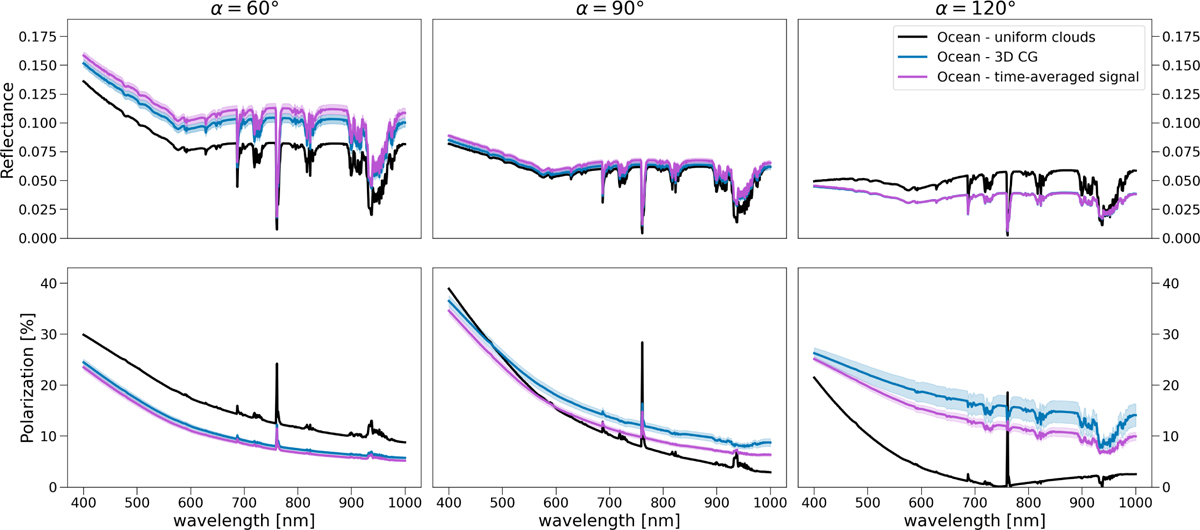
Comparison among spectra in reflected (first row) and polarized light (second row) for an ocean planet with a uniform cloud layer (black curve), the 3D CG model with 1σ variability over 12 months (blue curve), and the time-averaged signal model simulating 8 hours of integration time (purple curve). Different columns refer to different phase angles (α): 60, 90, 120°.
Current usage metrics show cumulative count of Article Views (full-text article views including HTML views, PDF and ePub downloads, according to the available data) and Abstracts Views on Vision4Press platform.
Data correspond to usage on the plateform after 2015. The current usage metrics is available 48-96 hours after online publication and is updated daily on week days.
Initial download of the metrics may take a while.