Fig. 12.
Download original image
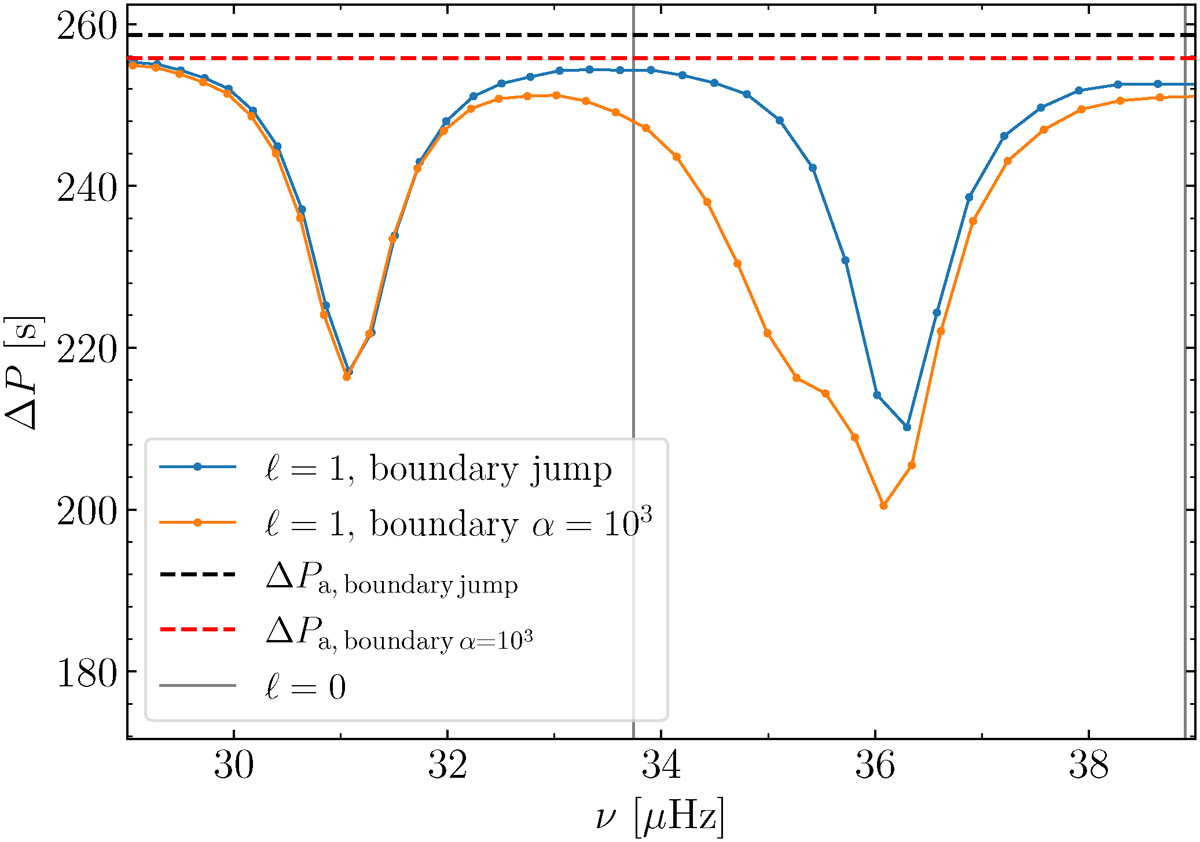
Comparison of two period spacings of mixed dipole modes within the observable region of the spectrum derived from different conditions at the core boundary. In particular, we show a model with a density jump (blue solid line), and a model with a smooth transition (orange solid line). The dashed lines denote the asymptotic period spacings for the model with a density jump (in black), and for the other model (in red). Furthermore, the grey lines correspond to the radial modes associated with both models, as they are indistinguishable in this scale. Notably, we observe clear differences in their period spacings, even in areas where dipole modes are detectable.
Current usage metrics show cumulative count of Article Views (full-text article views including HTML views, PDF and ePub downloads, according to the available data) and Abstracts Views on Vision4Press platform.
Data correspond to usage on the plateform after 2015. The current usage metrics is available 48-96 hours after online publication and is updated daily on week days.
Initial download of the metrics may take a while.