Open Access
Fig. D.1.
Download original image
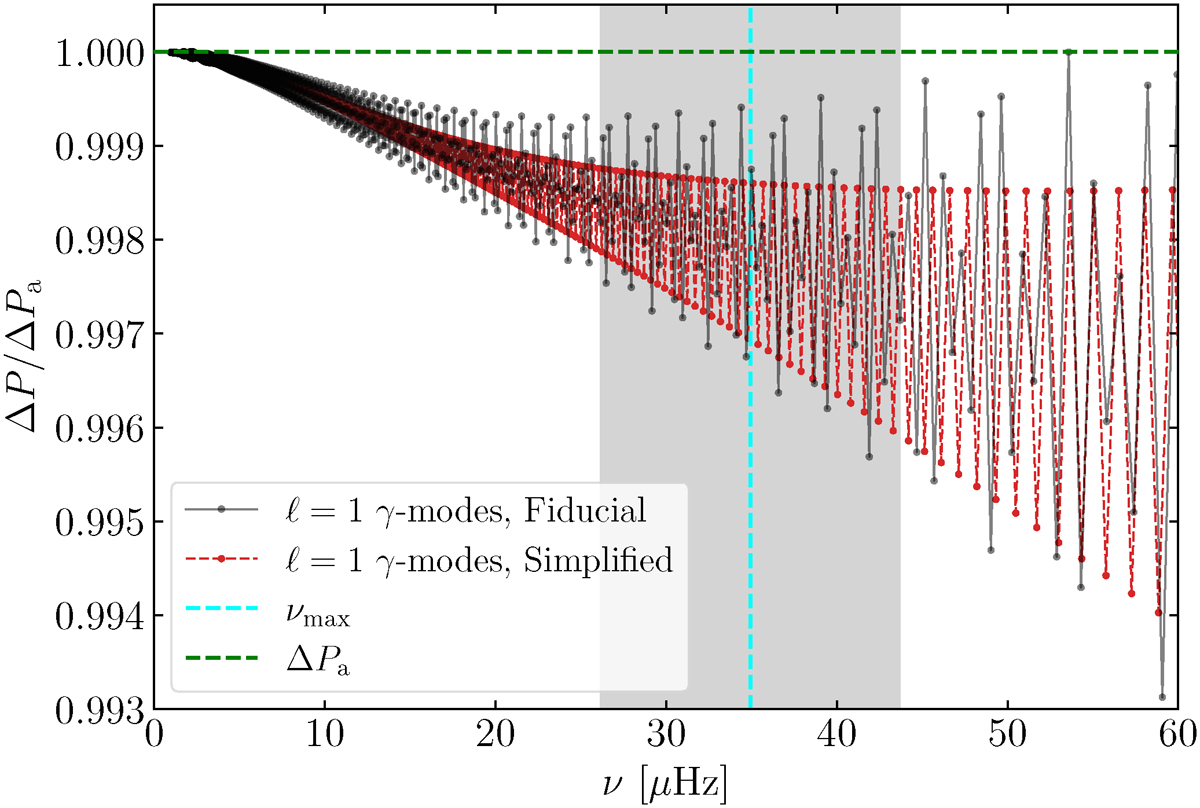
Comparison between normalised period spacings for the γ-modes as functions of frequency. The grey area represents the observable region of the spectrum and the cyan line the νmax. It is clear that the fiducial model (in black) and the simplified model (in red) have similar properties of the g-cavity.
Current usage metrics show cumulative count of Article Views (full-text article views including HTML views, PDF and ePub downloads, according to the available data) and Abstracts Views on Vision4Press platform.
Data correspond to usage on the plateform after 2015. The current usage metrics is available 48-96 hours after online publication and is updated daily on week days.
Initial download of the metrics may take a while.