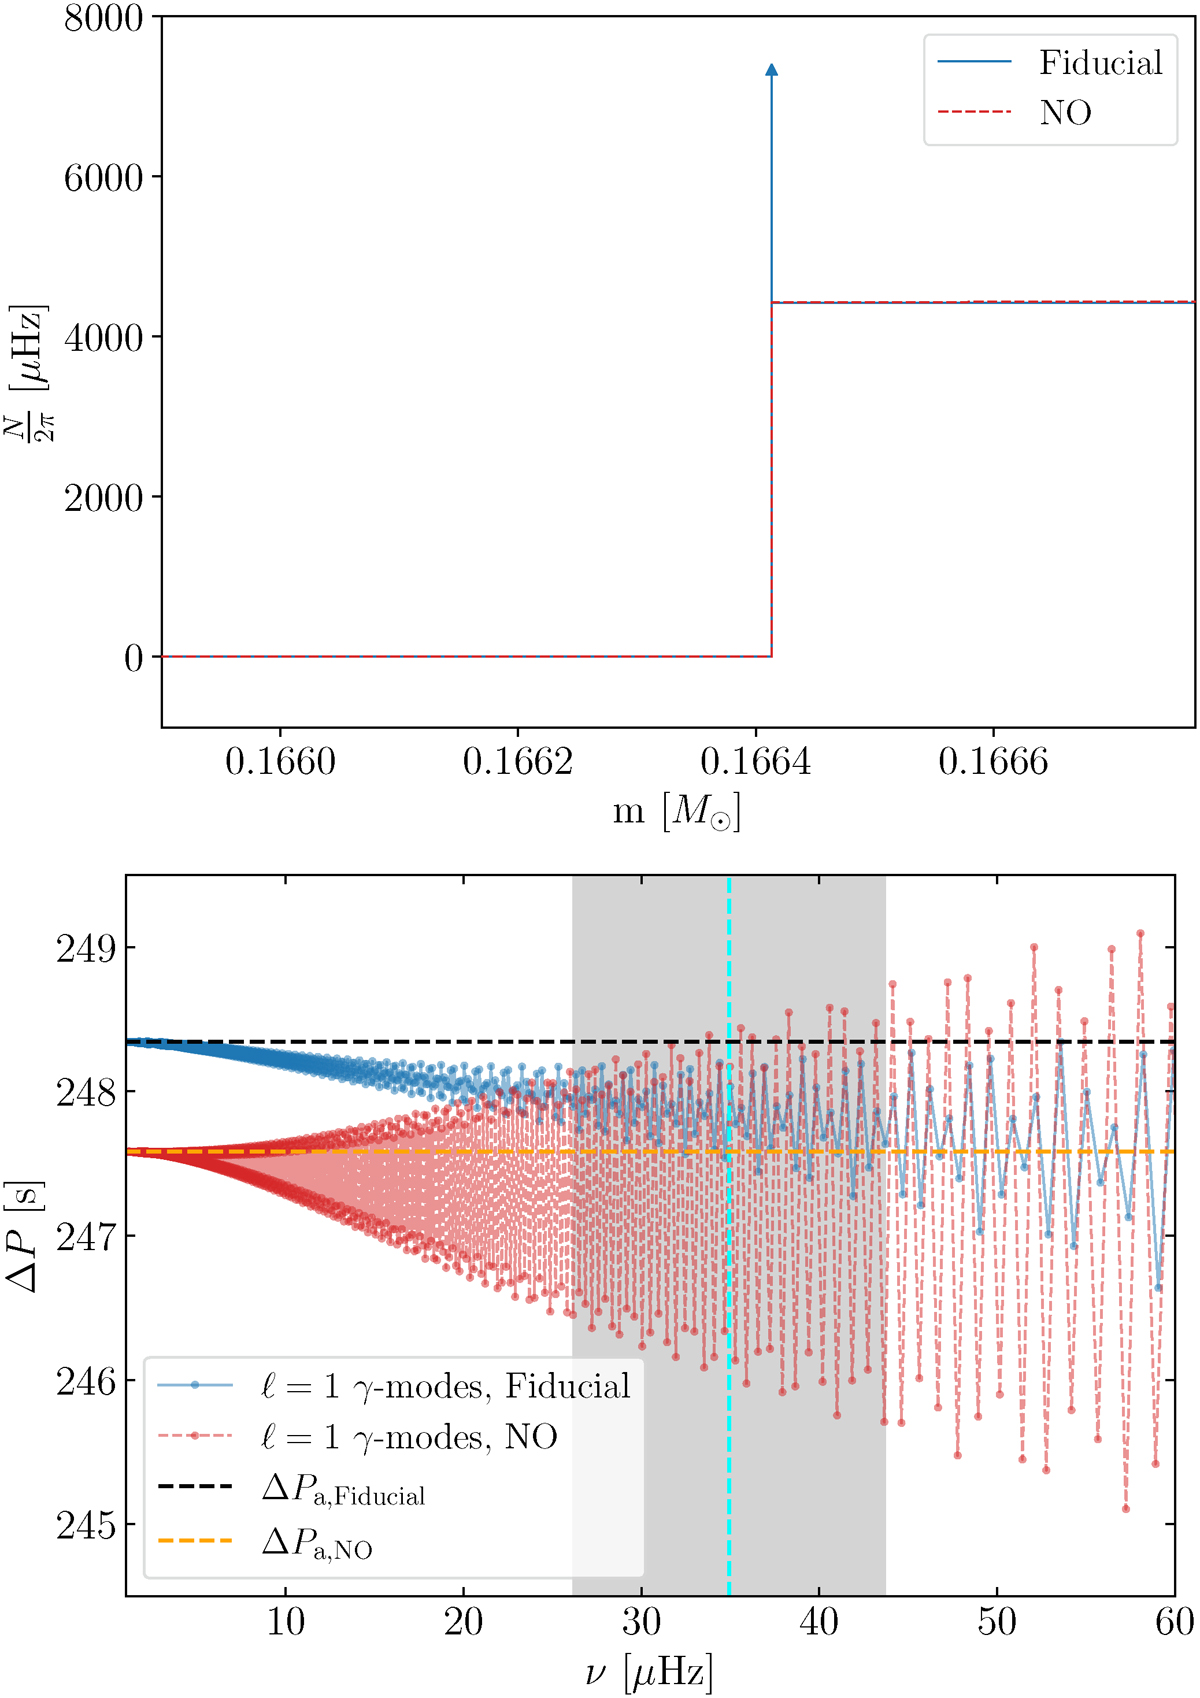
Fig. E.1.
Download original image
Comparison of N profiles as functions of internal mass (top panel) and period spacings of the γ-modes as functions of the eigenfrequencies (bottom panel). The blue line represents the fiducial model of Section 3, while the red model features a step-like structure in the N profile at the boundary between the convective and radiative core instead of a δ-distribution.
Current usage metrics show cumulative count of Article Views (full-text article views including HTML views, PDF and ePub downloads, according to the available data) and Abstracts Views on Vision4Press platform.
Data correspond to usage on the plateform after 2015. The current usage metrics is available 48-96 hours after online publication and is updated daily on week days.
Initial download of the metrics may take a while.