Open Access
Fig. 2.
Download original image
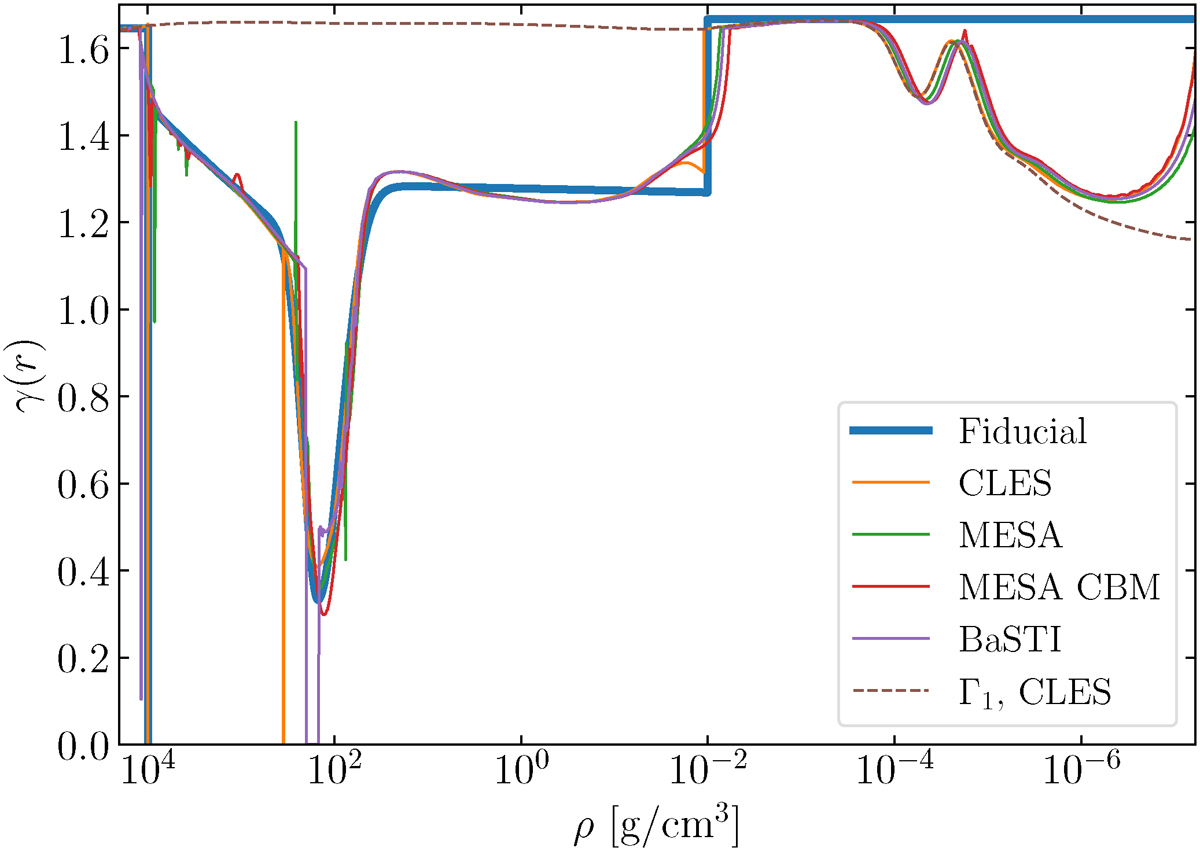
Comparison of γ(r) as a function of density for the five different models shown in Figure 1. The dashed brown line represents the Γ1 used by CLES v21.0 for reference. All five models share the fundamental characteristics of the CHeB phase.
Current usage metrics show cumulative count of Article Views (full-text article views including HTML views, PDF and ePub downloads, according to the available data) and Abstracts Views on Vision4Press platform.
Data correspond to usage on the plateform after 2015. The current usage metrics is available 48-96 hours after online publication and is updated daily on week days.
Initial download of the metrics may take a while.