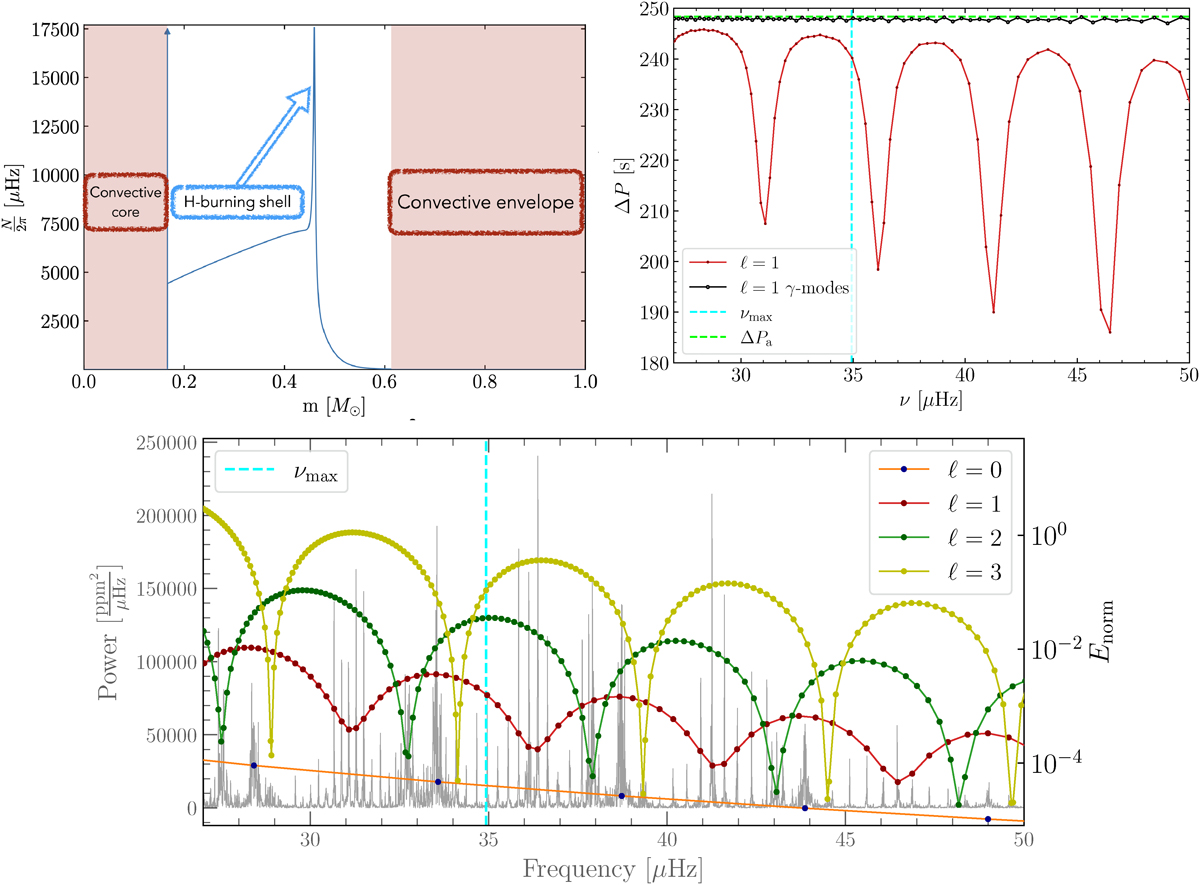
Fig. 4.

Download original image
Brunt-Väisälä frequency as a function of internal mass (top left), period spacing as a function of eigenfrequencies in the observable region of the oscillation spectrum (top right), and the corresponding simulated PSD (bottom) for the fiducial model discussed in Section 5.1. The cyan dashed line indicates the νmax of the reference CLES model. Along with the simulated PSD, we also show the normalised inertia of radial and non-radial modes (coloured dots connected by coloured lines).
Current usage metrics show cumulative count of Article Views (full-text article views including HTML views, PDF and ePub downloads, according to the available data) and Abstracts Views on Vision4Press platform.
Data correspond to usage on the plateform after 2015. The current usage metrics is available 48-96 hours after online publication and is updated daily on week days.
Initial download of the metrics may take a while.


