Fig. 8.
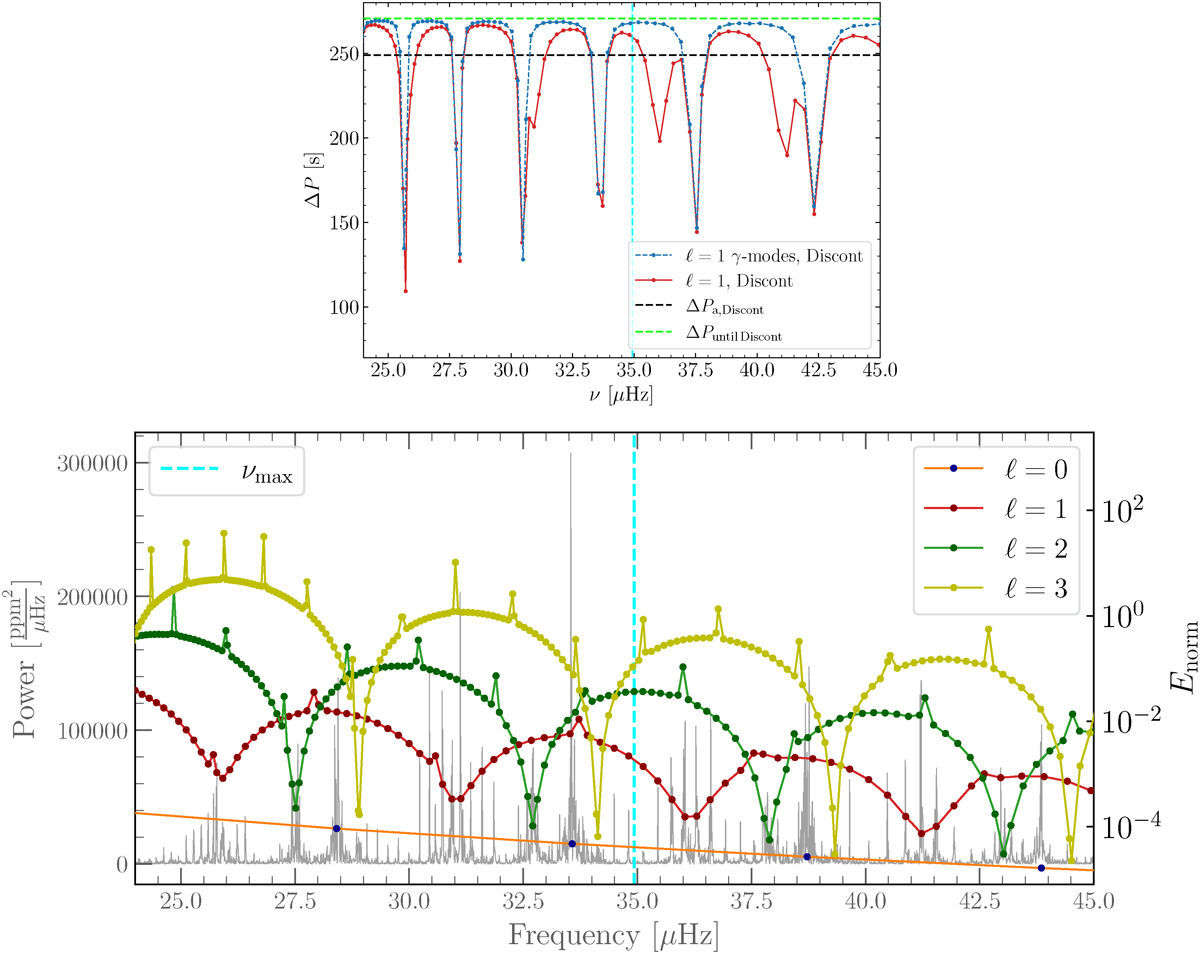
Download original image
Period spacing (top panel) as a function of eigenfrequencies for the model discussed in Section 5.3.1. We compare the γ-modes (shown in blue) with mixed dipole modes (in red) in proximity to the observable region of the oscillation spectrum, whose νmax is the cyan line. The black and lime lines are the same as Figure 7. Some minima in the period spacing result from mode trapping rather than the coupling between p-modes and g-modes, and not all of these minima exhibit observable amplitudes. This is further illustrated in the bottom panel, which presents the corresponding simulated PSD along with the normalised inertia of radial and non-radial modes (coloured dots connected by coloured lines).
Current usage metrics show cumulative count of Article Views (full-text article views including HTML views, PDF and ePub downloads, according to the available data) and Abstracts Views on Vision4Press platform.
Data correspond to usage on the plateform after 2015. The current usage metrics is available 48-96 hours after online publication and is updated daily on week days.
Initial download of the metrics may take a while.