Fig. 1
Download original image
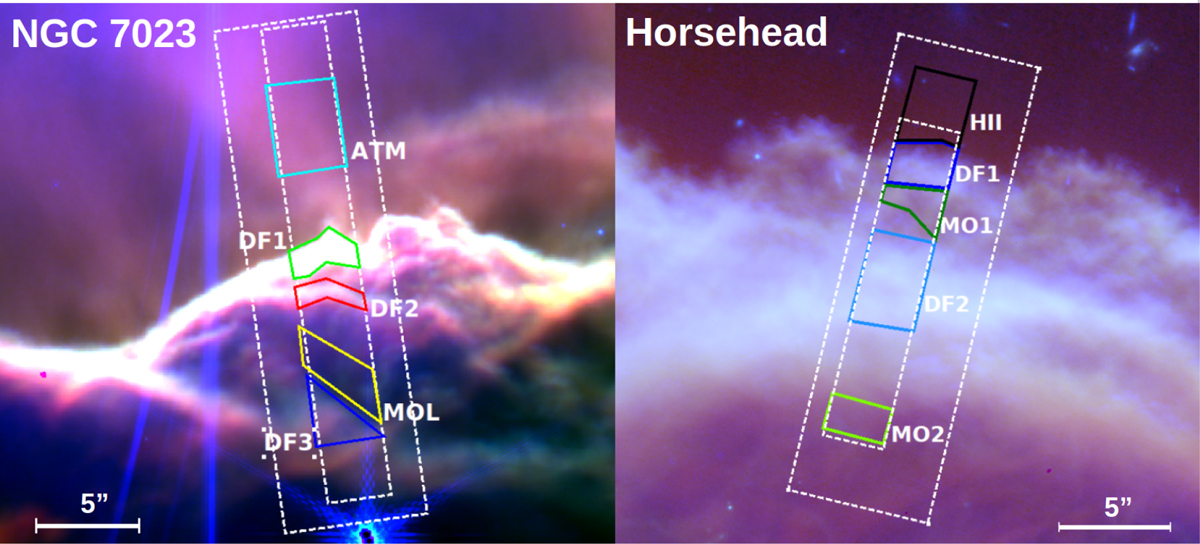
Extractions regions on images (blue = NRC-F210M, green = NRC-F335M, red = MIR-F770W) of NGC 7023 (left) and the Horsehead (right). The exciting star is off the top of the image in both cases. The color used to designate the regions here will be used in spectral plots for those regions, the remainder of the text. The white dashed rectangles define the minimum (NIRSpec) and maximum (MIRI channel 4) IFU mosaic coverage.
Current usage metrics show cumulative count of Article Views (full-text article views including HTML views, PDF and ePub downloads, according to the available data) and Abstracts Views on Vision4Press platform.
Data correspond to usage on the plateform after 2015. The current usage metrics is available 48-96 hours after online publication and is updated daily on week days.
Initial download of the metrics may take a while.