Fig. 15
Download original image
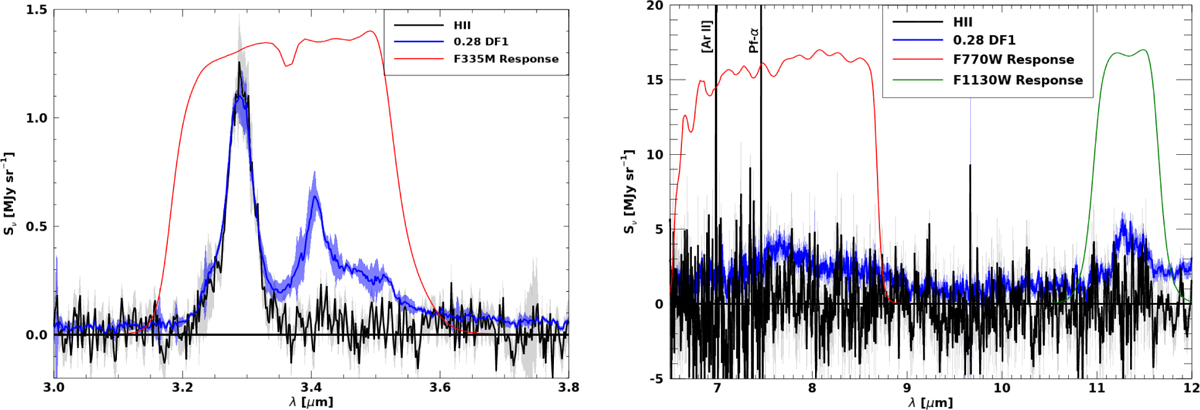
Left: H II and DF1 extractions around the 3.3–3.4 μm features. The DF1 spectrum has been scaled down by 72% so that the 3.3 μm bands match between the two regions. The F335M filter trace is shown in red. Atomic and molecular line emission contributes 6% and 12% to the H II and DF1 region emission, respectively, and the lines have been removed (Sect. 3.3). Right: H II and DF1 extractions around the 7.6 and 11.3 μm carbonaceous bands. All spectra have been smoothed with a five-pixel boxcar to emphasize any broad features. The DF1 spectrum has been scaled as on the left. MIRI F770W and F1130W filter traces are shown in red and green, respectively. In both plots, error bars (3-σ) are plotted as grey and blue-shaded regions for H II and DF1, respectively.
Current usage metrics show cumulative count of Article Views (full-text article views including HTML views, PDF and ePub downloads, according to the available data) and Abstracts Views on Vision4Press platform.
Data correspond to usage on the plateform after 2015. The current usage metrics is available 48-96 hours after online publication and is updated daily on week days.
Initial download of the metrics may take a while.